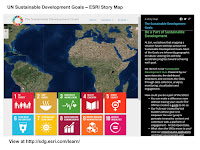
At left is a screen shot from an ESRI story map that shows areas of concentration for each of the 17 UN Sustainable Development Goals. Take a look.
These goals target the year 2030 for an achievement date and for the past year a growing effort has attempted to get more people involved. I wrote about this on the Tutor/Mentor blog, here, and here.
I've been following the #SDGs on Twitter.
Last August I created this graphic, combining my Race-Poverty in US concept map with the SDGs graphic. My goal was to show that places in the US face some of the same issues, and that all the issues are interconnected and have poverty as a root cause, or as a primary result.
While I think the ESRI map is great, I feel that individual story maps need to be created for each of the 17 goals, and that these maps need to focus on areas as small as a few blocks, in every country. This would show areas in the US and Europe where people live in pockets of poverty, isolated from the wealth that surrounds them.
While we need a global mobilization, problems will only be solved at the local level and without maps it's hard to focus on all of these places, or know if resources are being provided to help people overcome their challenges.
I've been aggregating links to data-mapping platforms, and share that information via this blog, a concept map, and links in my web library.
I hope that in the near future I can find a site that if building a similar collection of links, focusing on the Sustainable Development Goals.


No comments:
Post a Comment