Below is a map view showing three cities in Oregon, using a mapping product from Maptitude.

This map is part of an article on LinkedIn titled "How to use GIS to look at changes in employment patterns".
In the introduction the writer says "This article explores how to use GIS (geographic information software) in local or regional economics. Many times, local or regional governments, economic geographers or regional economists are asked to look at changes in employment patterns over a specific period within a particular geography (e.g., a city, township, or county) or between several geographies where a comparative analysis is required."
In the introduction the writer says "This article explores how to use GIS (geographic information software) in local or regional economics. Many times, local or regional governments, economic geographers or regional economists are asked to look at changes in employment patterns over a specific period within a particular geography (e.g., a city, township, or county) or between several geographies where a comparative analysis is required."
This is a detailed article with step-by-step instructions for building a map-view like shown above. You may not feel comfortable doing this work yourself, but if you understand the potential, you can share the article with others who might be able to fund this type of work in your community.

In my June 25, 2023 article titled "Where are non-school youth development programs most needed?" and in many other articles on this blog, I've encouraged the use of GIS software to do an analysis of community areas, similar to what is described in the Maptitude article, but different in purpose.
Here are just a few articles I encourage you to read.
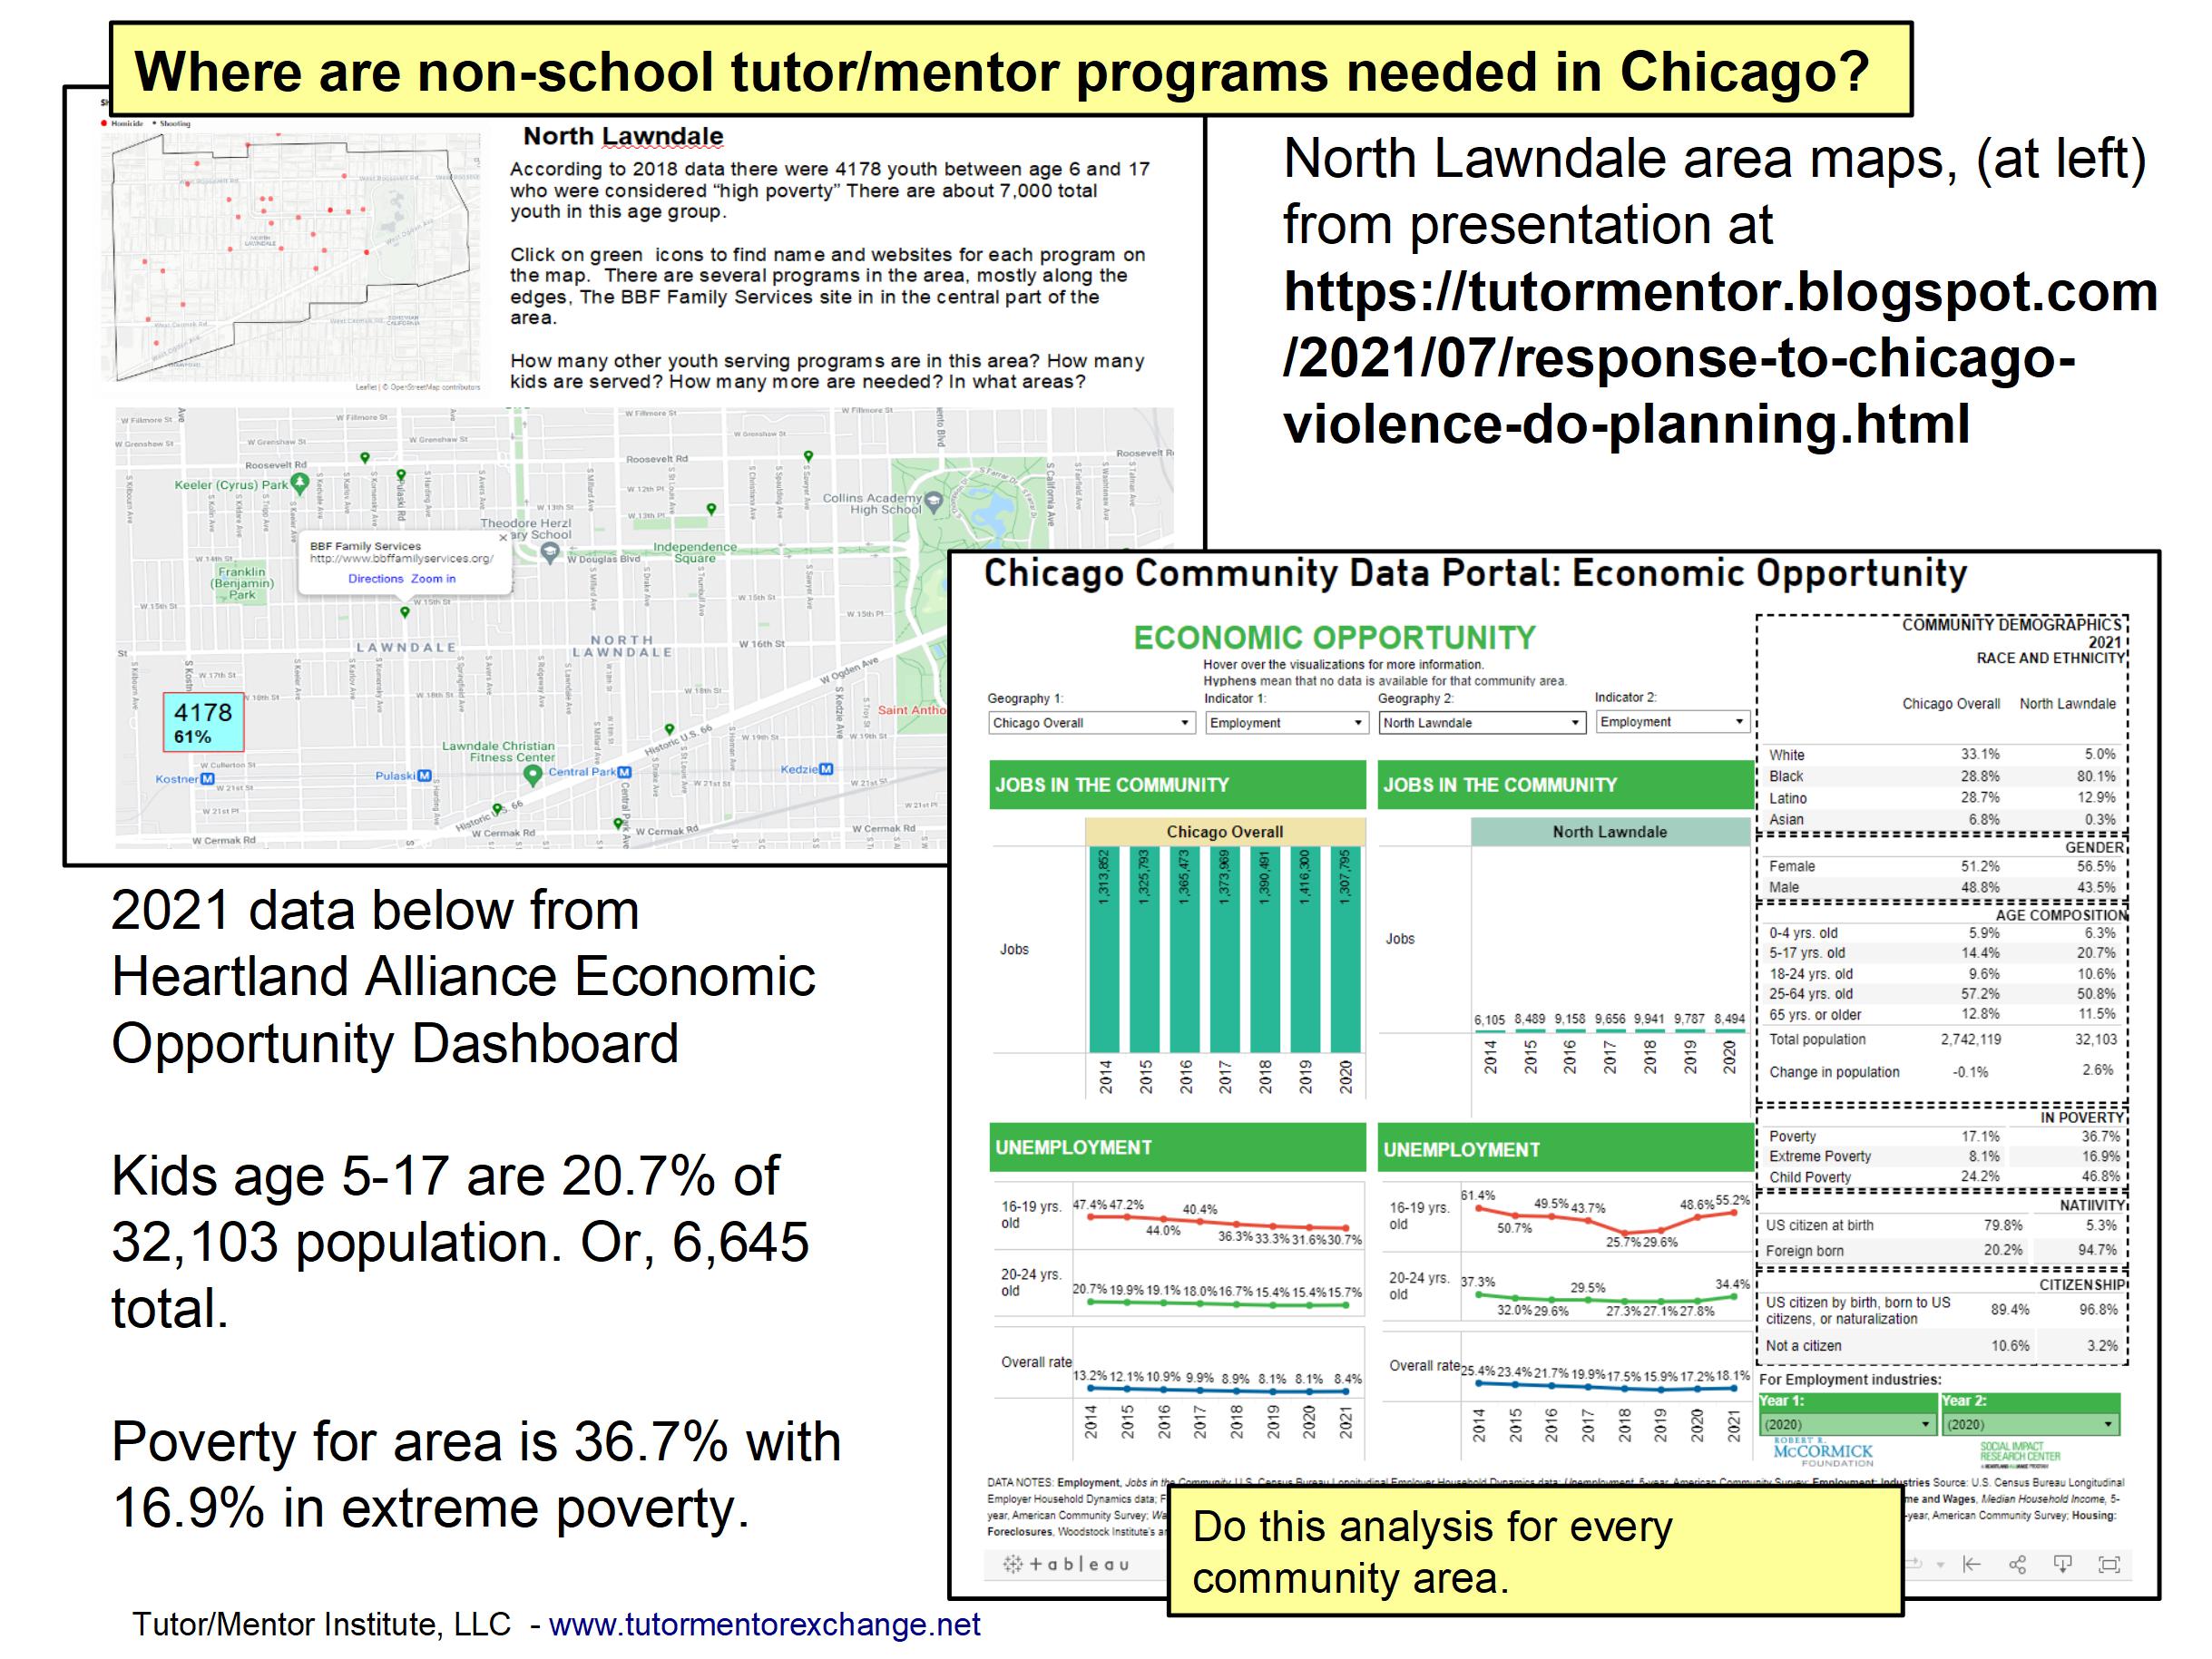
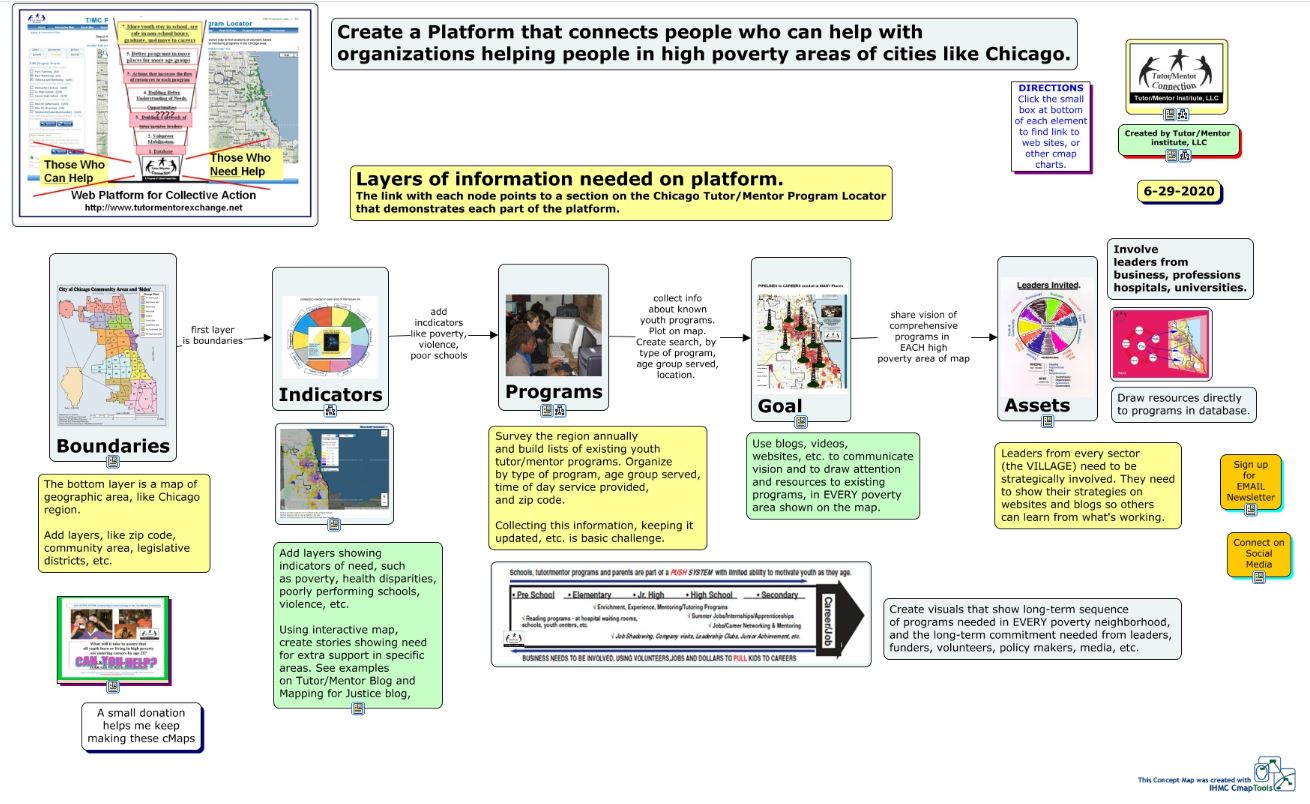
In this article I show the concept map below.
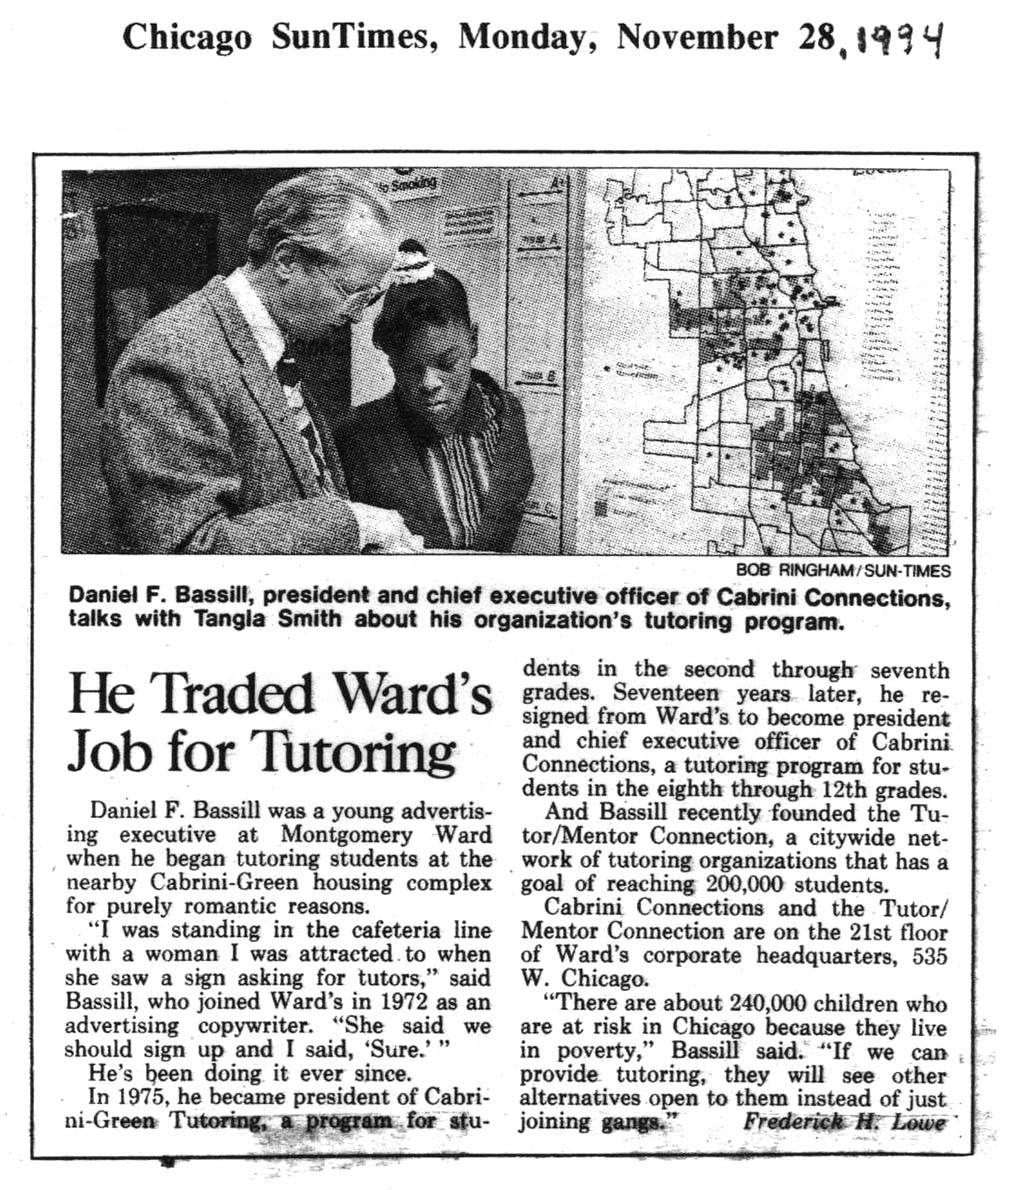
This 1994 Chicago SunTimes article shows me with a student from the tutor/mentor program I led at that time. In the background is a map of Chicago, with high poverty areas highlighted. I've been trying to harness this technology for nearly 30 years!
I've never been a GIS expert myself, thus always depended on volunteers or paid staff to make maps, and map stories for me. Since these resources were inconsistently available, I never have been able to do the type of analysis described on the Maptitude site.
Yet, I keep pointing to maps as tools that leaders in Chicago and other cities should be using.
Yet, I keep pointing to maps as tools that leaders in Chicago and other cities should be using.

Youth in non-school tutor/mentor programs, high schools and/or colleges could be learning to do this type of analysis and then sharing map stories to mobilize more people to become strategically involved in helping reach K-12 youth with on-going programs that expand their networks of "who they know" while helping them through school and into adult lives.
In these articles I outline a "Rest of the Story" strategy that young people, supported by professional mentors, could be leading.
In these articles I outline a "Rest of the Story" strategy that young people, supported by professional mentors, could be leading.
Please share my articles and help recruit people to do this work. If you know groups who already do this, share their website and blog addresses in the comment section and introduce them to me on social media.

Thank you for reading. Visit this page to find my social media platforms.
No comments:
Post a Comment