Tuesday, December 18, 2018

Child Care Availability Map

My Twitter feed today led to this post by @EveryChildMattersinIowa, who had just started following me. I clicked into their map, and it led me to this page, which contains child care availability data for every state, including Illinois, which I show in this graphic.

This is an interactive map, so you can zoom into different parts of Illinois and every state.  The way the Iowa group used it in a Tweet is exactly how I hope others will use maps, from the ones I make, to the ones I point to in blog articles on this site.

If you're doing this, post your link in the comments below.

Monday, December 17, 2018

Field Foundation Data Maps - Great Resource. Who Else Using It?

I was pleased to find this map on my LinkedIN feed today, which is from the Field Foundation of Illinois web site.  Visit the site and open this PDF and you will find a series of data maps, showing areas of Chicago where extra investment is needed, based on a variety of indicators.

If you have looked at articles on this blog, or this section of the Tutor/Mentor Institute, LLC blog, I've been using maps for more than 20 years to focus attention and resources to areas shown on the maps as needing extra help.

See map here
Among the maps in the Field Foundation pdf is one showing a lack of arts programs in high poverty areas.  What's not included is a map like mine at the right, showing the availability of non-school tutor and/or mentor programs in these areas.

I hope that I'll be able to connect with foundation leaders and that they will look at the many articles I've posted showing ways the maps can be used.  If they point to these, or write similar articles on their own web site, perhaps more leaders would be using the maps, and thus, more resources would be flowing into these areas.


One other resource I'd like to point to is this PDF that shows the number of high poverty youth, age 6-17, in each Chicago community area.  The map at the left shows the far North East part of Chicago, which includes Rogers Park, Uptown and West Rogers Park.  Based on the number of kids in these areas, investment in tutor/mentor programs is also needed here.

I've not been operating as a 501-c-3 non profit since 2011, so I'm not eligible for a Field Foundation grant, yet I have not found investors or a source of income to help me maintain and update my mapping platform.  A contribution to my FUND ME page would help.  A partnership with a foundation, university or business would help even more.

Wednesday, December 12, 2018

Network Analysis Tool for Twitter - Twitonomy

I've posted articles showing network analysis tools in the past. Thus, today I was excited to see the Tweet which is shown below.

I signed up for a free account and browsed around to see what's available. It's pretty easy to use. Blow is a screen shot of people who mentioned @tutormentorteam (me) between May and December 2018.


If you've read any of my past articles my interest in these tools is the potential to provide on-going support to community-building efforts, or bringing people together to solve complex problems, such as making well-organized, long-term, volunteer based tutor, mentor and learning programs available in every high poverty neighborhood of Chicago, and keeping them there for a decade or longer.

Without these analysis tools we could fill a football stadium with fans and still not know if we have the right mix of talent, experiences, political leadership, resource providers, program experts, etc present to work on solving our problem.

Unless we repeat the analysis on an on-going basis we don't know if our efforts are keeping these people in the conversation, and expanding the range of people involved.

I don't have the  time, talent, dollars or manpower to do this analysis myself in all the ways it should be done, which is why I keep inviting others, from Chicago, or any where in the world, who is interested in this, to reach out and introduce yourself.

Sunday, December 9, 2018

Digital Divide in Chicago - 2018 WBEZ article


This screen shot shows interactive map included in WBEZ article titled "Clear Signs Of The Digital Divide Between Chicago’s North And South Sides"

The article reports that "more than half the households in Englewood and nearly half the households in West Englewood (51 percent), Riverdale (49 percent), Auburn Gresham, and South Shore (both 46 percent), lacked internet access at home".

This is a disadvantage for youth and adults.

I show these maps and articles with the goal that readers will be concerned and will share the articles with others, who will also be concerned, and that this will result in people from different sectors giving time, talent and dollars to help reduce this problem.

Browse other articles on this blog, and the Tutor/Mentor blog, and share with your network, as the graphic below suggests.

This work is not something that can be done in a day, or even a year or a decade. But it is work that needs to be done.  If you'd like help digging through the information I'm sharing, or in making sense of some of the graphics, I'm available.

12-12-18 update - Visit this site and see 2018 data and maps showing digital access in census tracts across the USA.

12-19-18 update - World Economic Forum - report - Our Shared Digital Future: Building an Inclusive, Trustworthy and Sustainable Digital Society, 2022 goals. click here

1-16-19 update - World Economic Forum  report - Global Risks Report 2019

2-18-2019 update - Nearly one-in-five teens can’t always finish their homework because of the digital divide - 10/2018 Pew Research Center report - click here

2-25-2019 update - Digital Distress: What is it and who does it affect? Part 1. 2019 article focusing on "those on the wrong side of the divide (who) are being left behind, prompting the creation of strategies to ensure everybody can reap the benefits of this new age. click here

3-30-2020 update - Broadband is now our lifeline, but 20 million still lack access. click here

3-31-2020  update - Worst Connected Cities - 2018 from National Digital Inclusion Alliance -  click here

4-13-2020 update - Stop the Cap-Promoting Better Broadband, Fighting Data Caps and Usage-Based Billing - read articles at this link.

4-21-2020 update - Analysis of Digital Divide in California, including map and policy recommendations - click here

4/25/2020 update - One in five Chicago students lacks broadband. Here’s where they live - Chalkbeat Chicago story - click here

5-6-2020 update - Digital prosperity: How broadband can deliver health and equity to all communities - click here

1-24-2021 update - Mapping and Mitigating the Urban Digital Divide This article describes a grant to the Center for Data and Computing at the University of Chicago to create new maps that build better understanding and help mitigate the Digital Divide.  

3-18-2021 update - visit the "saving the world" set of articles on Paul Signorelli's blog and find many articles related to digital access, digital justice, and digital divide. Below are links to two articles.
- Promoting Universal Broadband Access With Lev Gonick (Part 1 of 2- (click here);
- Promoting Universal Broadband Access With Beth Holland (Part 1 of 3) -  (click here)

3-18-2022 update - This Robert Wood Johnson Foundation Tweet shows that "neighborhoods experiencing deep poverty are the least connected to broadband. The Tweet also points to a resource page on the RWJF website. 

6-6-2022 update -  Interactive map shows level of broadband connectivity in rural zip codes throughout the USA. This is a project of RURAL LISC. click here

11-22-2022 update - HBR article "How to Close the Digital Divide in the U.S."  - click here

If you appreciate what I'm sharing, please visit my FUND ME page and send a contribution.

Tuesday, December 4, 2018

Population Density of Largest US Cities

Population Density map
My Twitter feed brought to my attention this map showing population density in the largest US cities.  You can find the article describing contents of the map here, and the interactive map here.

I created the Tutor/Mentor Connection in Chicago in 1993 to help volunteer-based tutor/mentor programs grow in high poverty areas. As the Internet became a tool for me to gather and share ideas, I've sought out people in other big cities, because the challenges of concentrated poverty, segregation, inequality and population density are similar.

That means that some day I should be able to produce a map, with icons on each blue circle, indicating one, or more, people from that city is following me on Twitter, Facebook and Linkedin, reading my blogs, and interacting around the same challenges and questions I ask every day.

In 
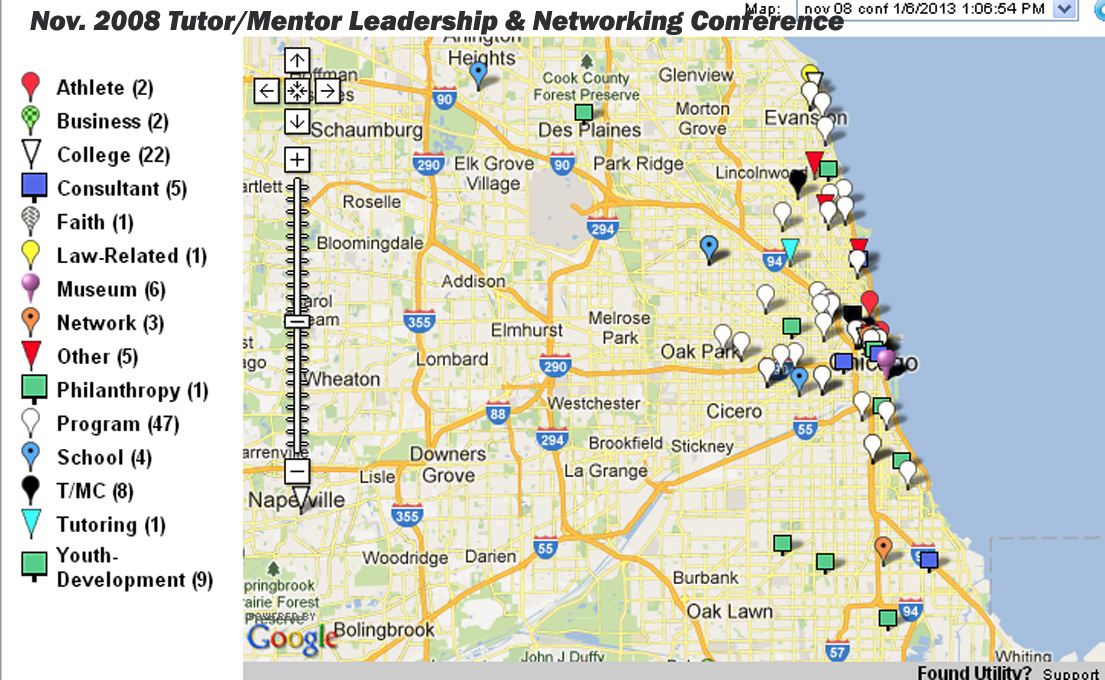
the map below I show people who attended Tutor/Mentor Leadership and Networking Conferences that I held in Chicago every six months from May 1994 to May 2015. If you compare it to the population density map, you could see that I was connecting with people from some of these cities.

May 1994-May 2014 conference participation map - click here
However, those connections did not turn into on-line connections and, for the most part, on-going connections.  They also did not include business leaders, funders and/or policy makers, which is one reason I no longer host the conferences and struggle to keep the T/MC alive in Chicago. 

I'm still trying, but I think it will take finding others from different cities to help with this effort. 

In addition, each city should have someone creating maps showing who is connecting on a regular basis to help needed youth serving programs grow in that city. The map at the right shows participation in one of the Chicago conferences. You can see several maps like that on this page

If this were happening it would indicate that groups of people are meeting within a city, and within neighborhoods of each city, and that they were connecting with people in other similar cities, with a common goal of helping economically disadvantaged kids more successfully through school, which has a economic benefit to the business sector and the entire urban region.

So far I don't see this happening.

Thus, if you're reading this. Share it with people in your own community and network who might also be focusing on filling high poverty areas of their city with a range of mentor-rich programs that reach more k-12 kids, last longer, and result in more being in jobs when they are in their mid 20's than what is the reality today, in 2018.