Wednesday, December 23, 2015

Chicago Most Segregated City in US - Brooking.edu

I included this map from a Brookings.edu article in a story I posted here in May 2015. 

Today I received another article from Brookings,edu, under the headline "The Most American City: Chicago, race and inequality". 

I have started using an annotation tool to highlight and comment on articles like this. Here's the link to the annotated version.  

The writer finises with a comment saying, "The broader tragedy of Baltimore, of Ferguson, of Chicago, is that black and Hispanic Americans in the poorest areas of our cities have such bleak prospects. The danger is that once the media bandwagon has moved on, these structural inequalities will remain."  

The strategies I've launched since 1993, through the Tutor/Mentor Connection, have aimed to keep attention focused on issues like this, even when the media are not paying attention.  Read stories on this blog and the Tutor/Mentor Institute, LLC blog, to see how I've been doing that for the past 10 years. 

Friday, December 11, 2015

Map of high schools in Chicago - Crain's web site

Crain's  has been running a series of articles under the headline of "Five Big Ideas for Chicago's Troubled Schools". Day four article includes an interactive map showing location of different types of high schools, overlaid on poverty demographics. Click on each dot on the map to see the identity of the school, graduation rate, ACT school and number of students enrolled.

Browse the map stories I've posted since 2008 and see how I've been trying to develop an interactive mapping platform that supports leadership planning and volunteer involvement.  I keep looking for partners and volunteers to help me keep my sites working, and to  upgrade them and teach more people to use them.

Friday, December 4, 2015

Analysis of Nonprofit Technology Funding

The Foundation Center has been doing some amazing analysis of philanthropic giving. This article talks about funding of technology for non profits that focus on democracy. 

Sunday, November 22, 2015

Use Interactive Map to Understand Flow of On-Line Donations to Different Zip Codes

I've just been introduced to a web page hosted by the Chronicle of Philanthropy, which hosts an interactive map that you can use to look at donations made in different cities, and/or different zip codes within a city, to charities in different categories. Here is the link.


I zoomed into the Chicago region, then clicked on different zip codes. For instance, when I click on zip code 60623, the Lawndale area of Chicago, I see $500 in human services donations and $465 in youth development donations.  The map below shows that the North Lawndale area has 4717 youth between age of 6 and 17 living in high poverty.  $465 in donations do not pay for many tutor/mentor programs for that many kids. 


The 60657 zip code, located along the Chicago LakeShore, between Irving Park Ave and Diversey Ave,  shows $30,173 in donations for youth development programs and $110,105 for human services programs.  Look at the map on page 7 of this presentation.  It shows that there less than 650 youth, age 6 to 17, living in the 60657 zip code, representing a low percent of all the youth age 6-17 in the zip code. My maps plot the number of youth by community area. Thus you'd need to look at this zip code map to know which zip codes cover which community areas. 

Keep in mind, this only shows one source of donations, so I'm hopeful that there are more funds going into high poverty zip codes than this platform might show. What I'm interested in is the potential to gather information on philanthropic and government funding from many sources, and focus it on individual zip codes, and individual categories of non profits, and then teaching people to use this data to tell stories that help improve support of organizations in high poverty areas.  

Last week I posted a story on the Tutor/Mentor blog, following the high profile shootings of a 9-year-old boy and a 20-year-old girls. In that story I showed maps of political districts, illustrating that preventing youth violence was the responsibility of many layers of government. Take a look

My goal is to teach leaders, volunteers, youth and community activists in different neighborhoods to create their own map stories, following my examples, and using platforms like the Chronicle of Philanthropy to show how poverty neighborhoods are under funded by government and philanthropy, and to work together to try to change this over a period of years and constant story telling.

I feel that more people, with diverse talents that are  much more creative than mine, are publishing these map-stories on a regular basis, we'll begin to influence a better distribution of resources into all poverty neighborhoods, and thus the growth of more and better programs helping young people and families overcome the challenges of poverty.

If you're creating such stories, share your link. If you'd like me to give a talk or coach you to take this role, I'm available for a small fee.

2-27-2017 update - the links to the Chronicle of Philanthropy site no longer work. I'm not sure if they have discontinued the site, or not. If it's been discontinued, that would be too bad. It shows how difficult it is to build and maintain data mapping.


Saturday, November 21, 2015

Using Systems Thinking to understand & respond to Terror Attacks

I've pointed out  uses of concept maps on this blog and written a few articles about Systems Thinking on the Tutor/Mentor blog.  Today I was introduced to a page on the Know-Why-Net web site that is mapping a " Systemic view on terror threats after the 2015 Paris attacks."  Click the link .  

Know-Why-Net before. This visualization of the terror threat and response is just one of many visualizations on the site. I encourage you to visit and build your own  understanding of these tools.

Friday, November 20, 2015

National Center for Charitable Statistics

A couple of years ago I was introduced to a platform hosted by the Foundation Center, named the Philanthropy in/Sight map. I included a graphic from that site, and a link in this 2014 article. That link no longer works and in a meeting this week I learned that the Foundation Center had discontinued this program.

I also learned that the National Center for Charitable Statistics, a program of the Urban Institute, has replaced this service. I've just started to browse the site and become acquainted with its features. I encourage others to do the same and use comments on this blog, or your own blog articles, to describe those features and how they are being used to improve philanthropic support of hard-to-fund organizations like those serving youth and families in high poverty areas.

Monday, November 16, 2015

Availability of tutors in high poverty zip codes of Chicago

I've been creating maps to show where volunteer-based tutor/mentor programs are most needed in Chicago and other cities, based on poverty levels, poorly performing schools, violence and other indicators. Scroll through this blog to see articles using such maps. View this PDF to see a set of maps showing the number of youth, age 6-17, who are in households below the poverty level, in each Chicago community area.

Most of my maps include Chicago tutor/mentor program location information from a Directory of volunteer-based tutoring and/or mentoring programs operating in high poverty areas of Chicago, which I've been maintaining since 1994. See my list.

I focus on volunteer-based, and normally free, tutoring, mentoring services, realizing that parents in these areas don't have the income to support paid tutors, and that paid tutors, because of the cost, could not remain part of a young person's life for more than a few weeks or months, not for multiple years.

Thus, I've not focused extensively on the availability of for-profit tutors (who charge an hourly fee). This weekend I was introduced to a web site that is trying to collect this information. After some email conversations the site's owner, a University of Chicago graduate, created a map showing the number of tutors in his database, for each zip code in Chicago. The site includes a search feature that enables you to search by zip code, to get contact information for tutors who focus on that zip code. Furthermore, it shows the average cost per hour charged by tutors in different zip codes.

The site is named "Find Tutors Near Me" and you can find information about Chicago at this link.

Sunday, October 18, 2015

Using Maps in Violence Prevention Strategy

Last week's on-line verions of the Chicago Tribune, included a column by Dawn Tice Turner, titled "Interactive maps could combat Chicago violence". This featured the mapping strategies I've tried to develop since the mid 1990s. Read more on the Tutor/Mentor blog.

Today, 10-21-15 the Chicago Tribune used page 3 to share Dawn Turner Tice's story from last week.


Browse through all of the articles in this section of the Tutor/Mentor Institute, LLC web site to see ideas for using maps. Connect with me on LinkedIN, Twitter or Facebook if you'd like to help develop this capacity.

Friday, October 2, 2015

Mass Shootings vs Urban Violence

Yesterday's mass shooting in Oregon has led to a wave of new stories showing mass shootings in the US, prompting front page headlines. At the same time, constant violence is generating front page headlines in Chicago. Are these the same? Should they be discussed in one big conversation? Or are there different root causes, which need to have in-depth conversations? What information is available?


My Facebook and Twitter feed are full of stories about the mass shooting in Oregon, pointing out how this has become an epidemic across the USA. A few sites are using maps to show where these incidents have taken place. This Mass Shootings in US since 1966 report is one. Here's an analysis of data on this map, from the MotherJones site.

Here's another site with a good analysis of mass killings. Note that both of these map analysis reports do not focus on gang involved shootings/killings. I looked for maps showing gang involved shootings in the US. Here is a WBEZ map analysis showing gun violence in Chicago from 2002-2012. Here's another site that seems to include both mass killings and gang related gun violence across the country.

If you are motivated to get more involved, visiting these sites, then inviting friends, family, etc. to also visit the sites, would be a good start.

While mass shootings hit randomly in different towns/cities, they do not occur daily in the same town/city the way shootings do in Chicago and other cities., While access to guns is a common factor, root causes and possible solutions may differ.

Can you point to web sites where these similarities and/or differences are being discussed?

I collect and archive information like this on blogs and in the Tutor/Mentor Connection web library so that others can read and begin discussion causes and solutions without needing to do the searching for articles.

I support volunteer-based tutor/mentor programs that engage adults who don't live in poverty because those adults are a form of bridging social capital that can open doors to aspirations and opportunities beyond what urban youth see modeled every day in their own neighborhoods. However, I also view these programs as a strategy for engaging adults who don't live with the same daily challenges, such as daily shootings that terrorize even those who are not the targets. Unless we find ways to engage more people on a personal, self-interested level, I don't think we'll ever generated to public will to build sustained, long-term solutions to urban poverty, and urban violence.

I think the mass shootings plaguing the country have a different root cause, and possibly, a different set of solutions. What they have in common is an easy access to guns and ammunition. Take that away and the conversation is different.

Thursday, October 1, 2015

Resources for Community Development Planning

This blog, and the Tutor/Mentor Blog, are primarily focused on helping mentor-rich, non-school, volunteer-based tutoring, mentoring and learning programs grow in areas of high poverty. By "grow" we mean first, there needs to be some organizational structure/team that operates a youth program in an area of the city and suburbs where such programs are needed. Second, we mean such a program is able to attract talent and resources, and is constantly learning from its own results, and from what others share on their own web sites. Third, such programs engage youth, volunteers and community members in on-going efforts to understand WHY such programs are needed, and WAYS the program and its members can help the youth in their programs move more successfully through school, and into adult lives. That means we want the result of what we do to help kids be working in jobs with livable wages once they are entering their mid-twenties.

There are many stories on the Tutor/Mentor Blog that point to information related to these goals. Most of the stories on this blog focus on uses of maps to make sure programs are available in all the neighborhoods where they are most needed. Many stories also show uses of concept maps, as a tool for communicating ideas and strategy.

Below is one resource that we've made available to planners. In this pdf the number of youth, age 6-17, who are under the poverty level, are shown. Thus, if a neighborhood has 1000 kids in poverty, it might need 20 tutor/mentor programs that each serve 50 kids to serve 100% of those kids. That's not a realistic expectation, but having no programs or just a few, is an undesirable level of program availability.

Chicago Community Areas_Youth in Poverty Analysis by Daniel F. Bassill


If you follow the links on the side of this blog, and scroll through stories written since 2011 you'll see that I point to other mapping platforms. The Program Locator that the Tutor/Mentor Connection created in 2008 only shows known tutor/mentor programs, and uses poverty data and school performance information to show indicators of where programs are needed. It also has a section showing assets, such as banks, drug stores, faith groups, colleges and hospitals, who could be part of neighborhood planning groups in different community areas. Unfortunately, I've not been able to update this since 2010, and recently error codes on the database make the site un-usable. I'm looking for help to fix this.

That means the other mapping platforms I point to need to be used to create map stories showing where tutor/mentor programs are needed, and you'll need to add your own information showing existing (if any) programs already operating. The Chicago Programs Links library is one resource you might use to identify programs you could add to your map.

I keep finding new mapping resources. When I do, I write a blog article, like I am now. And also add the resource to this section of my web library.

Today I was browsing through the Quality of Life Planning section on the LISC-Chicago web site and found this Chicago Neighborhoods 2015 page on the Chicago Community Trust web site. This points to a City of Chicago’s 2013 Citywide Retail Market Analysis, which divides the city into 16 business districts.

For each district there is a map, along with demographic and business data. Community planners could use these maps, along with my maps, and map views created using other platforms, to build a case for more non-school tutoring, mentoring, learning, jobs and recreation programs, along with a strategy of engagement, identifying assets and leaders who need to be involved in building on-going visibility and a consistent flow of funding to the neighborhood, to support the growth of all of the organizations that planners show are needed.

If you know of other resources like this please share. More importantly, if you know of ways communities are connecting on-line for deeper learning and more frequent interaction, complementing the on-the ground planning and traditional meetings, share that information, too.

If you're an organizer, or a teacher, I encourage you to use stories like this to stimulate discussion of work that needs to be done to make neighborhoods safe and great places to raise kids and build families.

Sunday, September 20, 2015

Chicago Shooting Victims - Map

View this map on the Chicago Tribune web site to see where shooting victims are concentrated in Chicago. Use other maps on this blog to see where poverty is most concentrated, and to create map stories showing the link between high poverty and high violence. Then use the ideas shared on the Tutor/Mentor Institute, LLC site to build strategies that make hope and opportunity more available in each of these neighborhoods.

Sunday, September 6, 2015

Mapping Social Media Networks - NodeXL Tutorial

During a Friday Twitter session I met Marc Smith of the Social Media Research Foundation, which has created an open source tool caled NodeXL, which can map Social media conversations. I gave him a list of hashtags, and he produced the map below.

2020 update: NodeXL maps created prior to 2019, such as this, are no longer available. You can go to this map gallery and search for any of the hashtags I show in this blog, and find maps that include those hashtags.  
Here's a link to NodeXL maps using "tutor mentor"

For this graphic, I asked Marc to track these hashtags: #mybrotherskeeper OR #afameducation OR #gradnation OR #educationnation OR #achievementgap OR #ednation OR #skills_gap OR #oppindex OR #amgrad OR #gangviolence OR #globalcities2015 OR #blackmaleachievement OR #disconnectedyouth OR #placematters OR #endchildpoverty

If you open the map you can click into an interactive version. Zoom in and you can run your mouse over each node to identify the people who retweeted or commented on one of the above hashtags over the identified time frame. The report included with the map shows key influencers, or hubs, which are people at the center of clusters with numerous other nodes. The report also includes a list of the top 10 influencers. Thus, if you're building your network you might want to follow, or retweet, these people.

On Sept 7 I requested a second NodeXL map. Here's a link to maps using "tutor mentor".  You can search on map gallery and see if there are other maps with #tutor OR #mentor OR #tutormentor OR #mentoring OR #tutoring.

I'm still trying to figure out how to make sense of this, and to learn how this can be used to help build and sustain networks of people and organizations focused on solving complex problems, but decided that you could learn along with me if I share the links that Mark shared on Friday.

Network insights into social media:

Slides http://bit.ly/1GV8ZHY - this is long. I think the last few slides, showing how this analysis helps you identify people to follow and strategies for building your own network, are of great value.

Video http://bit.ly/1FGWq07 The video covers the material in the slides.

Mapping Twitter Topic Networks (click here) - article on Pew Research Center Site. This article offers a great deal of clarity to what you're seeing when you look at one of the NodeXL map.

NodeXL code and discussion page: http://nodexl.codeplex.com/

Social Media Research Foundation Blog Please see: http://www.connectedaction.net/#Blog

Marc's been creating maps for the #blacklivesmatter hashtag. As you build your understanding of how to interpret and use these maps, you'll find a whole gallery to review.


I've been interested in Social Network Analysis (see page) for many years and formed this group in my Tutor/Mentor Connection forum in 2010 to support interns and volunteers aiding me in mapping participation in conferences that I've hosted. Understanding your network is the first step toward building your network, and bringing together communities of people who might share time, talent, ideas and resources to help close the inequality and opportunity gaps in America. Visit the Tutor/Mentor blog and you can find many article I've posted about network building, network analysis and networking.


My goal is that the work we're doing will be duplicated by others who organize and host their own events and the result will be more people connecting, and staying connected, to information, each other, and complex problems that require long-term involvement in solutions. It looks like NodeXL and the Social Media Research Foundation offer some exciting support for this effort.

If you've written anything showing how to understand and apply NodeXL please share with a comment below. I'd like to build up a collection of links that can be referred to by others on an on-going basis. As I collect additional articles I'll add them to the comment section below so this becomes a long-term reference document.

If you'd like to request a NodeXL maps from Marc, use this page to submit your request.

3/29/16 update:  Here's a YouTube video where Marc Smith introduces Node XL

10/16/21 update: Dr Graham Mackenzie, GPST3, Edinburgh, Scotland, has been doing some of the best analysis of applying SNA to understand event participation.  This link points to many articles that he has written.  

Monday, August 31, 2015

Mapping the Opportunity Gap - GatewatytoCollege

Just found this Gateway To College map.

I'll reach out with an introduction. Hopefully some of the ideas I share here and on the Tutor/Mentor Blog will be used in their own efforts.

Thursday, August 27, 2015

2010 Census data on interactive map

This just came across my Twitter feed. Open the link and you'll find a map of the USA, with the 2010 census data plotted, and color coded for different racial groups. It clearly shows how big cities around the country have the greatest concentrations of minorities, and the greatest challenges of race and inequality issues.

Sunday, August 16, 2015

South Carolina use of maps - follow their example

This report came across my Twitter feed today. It's titled: "Getting to Ground Truth: Integrating Social and Spatial Statistics to Support our Communities’ Most Vulnerable Children and Families" and is published by the Children’s Trust of South Carolina.

What I like about the report is that it serves as a guide that leaders in Chicago and other cities might also use.

In many of my articles, like this one, I emphasize a use of maps to plan for a distribution of programs and resources into all high poverty areas of large urban areas.

Friday, August 14, 2015

Poverty growing in cities. New report.

My Twitter feed brought this article to my attention. It's titled "More People Living in High-Poverty Neighborhoods, Researcher Says" Open this link to find the full report, by by Paul Jargowsky, a fellow at the nonprofit Century Foundation.

I share this with the goal that people who find this blog will forward the articles to people in their own networks, and will lead on-going discussions of the information, so more people become informed and involved in reducing poverty and inequality in the US and around the world.

Thursday, August 6, 2015

Another Example of Data Mapping

Visit this Urban Institute page and see a story about crime changes in Washington, DC from 2000 to 2014. Not sure if this is yet available in other cities.

Wednesday, August 5, 2015

Use Community Commons Portal to create map stories

If you browse through past articles on this blog you'll see examples of how the Interactive Tutor/Mentor Program Locator has been used to create maps of community areas of Chicago where indicators such as poverty, poor schools, violence, etc show a need for more youth and family supports, such as organized volunteer-based tutor/mentor programs.

Due to a lack of talent and resources since 2010, features of the Program Locator that allow you to zoom into zip code, community area and political district boundaries are not working. In addition demographics still represent the 2000 census and the tutor/mentor programs shown on the map no longer represent close to 100% of those organizations operating in the Chicago region.

Thus, in many of my articles I point to other mapping and data platforms. One that I encourage you to browse and learn to use is the Community Commons portal. Visit this page and you can enter Chicago, Detroit or any other city, and see an interactive map showing poverty levels for that city. These maps also include info on political districts.

Using this information many users can create map stories, like this one, that they share in blogs, web sites, presentations, etc. which are intended to build attention, and participation, in efforts that fill the map areas with programs that reduce the levels of poverty over a period of many years.

Wednesday, July 22, 2015

Million Dollar Blocks, more

On Tuesday night I attended the weekly Chicago Hack Night event, and learned of a new web resource called ChicagosMillionDollarBlocks, The site focuses on the high costs of incarceration, and looks at this on a block-by-block level. The maps communicate a message that is also shown on other maps I've pointed to on this web site. If you're in a poor neighborhood, you suffer more than if you're in a more affluent neighborhood.

I encourage you to browse the map and become familiar with the information.

In my Twitter feed today I saw another map-based resource. The US Department of Education has created a set of maps to help people understand public school discipline and suspension and how this differs in different places, and for different students.

I'd like to see each site that host interactive data maps host a presentation like the one below, showing people how to zoom into the maps, to create jpgs that can be used in 'map-stories' that build greater understanding, increase the number of people interested in the topic, and increase the number of people spending personal time, talent and dollars trying to create change.

How to Use Chicago Tutor/Mentor Program Locator to Make Your own Maps by Daniel F. Bassill


If you're interested in the topic featured on these maps, or in any of the other articles I've posted on this blog, send out a message on social media encouraging people you know to take a look at the articles and the web sites. Do this once a week and you're already taking an active role in making change happen.

Wednesday, July 15, 2015

Mapping Philanthropy - Combining data

For the past few years I've been using this blog to highlight mapping platforms hosted by others, in addition to showing how GIS maps and concept maps can be used to communicate ideas and mobilize resources.

Today I read an article in the Chronicle of Philanthropy that used two different data sources to create a map showing different levels of philanthropic giving in every county in the USA. One set of data came from a How America Gives map, created by The Chronicle. The second map, was created by the Opportunity Index. By combining data from both maps, a more comprehensive picture of giving was created. Visit the site and read the full story. Share with your friends on social media so more people take a look at this.

As you look at these maps, look for ways to recruit teams of students, volunteers and professionals who will create map stories that focus attention on specific neighborhoods of where the need for philanthropic support is greatest. In the Tutor/Mentor Connection Map Gallery, we've posted some map-stories created in past years, as examples of the type of stories that need to be written over, and over, by many different people, but for the common purpose of generating more consistent, on-going and flexible support for volunteer-based tutoring, mentoring and learning programs operating in different neighborhoods of Chicago and other cities around the country (world).

Thursday, July 9, 2015

Poverty Rates per US School District - maped

This Washington Post article introduces a new interactive mapping platform shows Census Bureau poverty rates in each of the nation’s nearly 14,000 school districts nationwide. It was created by a new organization, called EdBuild.org

I hope to see stories from anti-poverty and inequality activists using these maps to draw support to new strategies that improve the learning paths for kids in these areas.

Mapping Segregation in Cities

The New York Times has created an interactive map that maps segregation patterns in major cities, such as Chicago. Local activists should learn to use these and other data maps, in stories that draw more people into engagements that solve the problems shown on the maps.

Concentrations of White poverty in Chicago - almost none!
This WBEZ article focuses on White poverty in Chicago. It's map shows only two census tracts, in the Rogers Park area on the North side, as being "high poverty".  Read the article.

Update: 11/21/2017 - Here's 2017 Brookings.edu article about segregation, titled "60 years after Brown vs Board of Education, how racially balanced are America's public schools?"  Look at the interactive map  to see racial mix for more than 86,000 public schools.

Update: 1/9/2018 -Here's article about school segregation in US cities. Title is We can draw school zones to make classrooms less segregated. This is how well your district does. Is your district drawing borders to reduce or perpetuate racial segregation?

Saturday, July 4, 2015

Duplicating this discussion in different cities

I included this map of Minneapolis in a 2014 article on the Tutor/Mentor Blog.

Today I read a Brookings.edu article, titled The Changing Face of the Heartland: Preparing America’s Diverse Workforce for Tomorrow. It's a long article, but full of maps and charts and ideas that a relevant in Chicago and every other urban area of the country. This article not only focuses on the economic need to find ways to parepar minorities for greater roles in the workforce, but talks about the type of long term philanthropic support needed to achieve desired outcomes.

One quote from the article says "We’re not talking about a pilot program or a two-year effort. … We’re talking about a 5–10 year commitment, and [dollar] numbers much bigger than what you might have had in mind. … "

We need this type of discussion, with the same use of maps, in every city. If you can point to a site where a similar article focuses on Chicago, please share it.

If you don't have the Brookings.edu daily bulletin sent to you, I encourage you to subscribe. Some of the best writing on opportunity and equality that I've found.

Thursday, June 25, 2015

Mapping Event Participation as Part of Building Network

I've signed up to participate in the 2015 Connected Learning MOOC (#CLMOOC2015) and added myself to their participation map. You can zoom into this map to see who is participating from different parts of the world. I zoom into Chicago with the hope of seeing more than a few people on the map who might be taking advantage of this learning and networking opportunity.

Since 2013 I've been participating in MOOCs like this, and sharing the idea of mapping participation. The map at the left is from a Deeper Learning MOOC. It's on a different mapping platform than the #CLMOOC, but it works the same way. Zoom in to see who is participating. Again, too few people from the Chicago region.

I've been hosting Tutor/Mentor Conference in Chicago as part of an overall strategy aimed at bringing people together who would work to help mentor-rich non-school tutor/mentor programs become available in more of the high poverty neighborhoods of Chicago. I've created concept maps to show the range of talent needed to achieve the goals I've stated. In recent years I've used maps to show participation of past conferences. Click here to see these.


During Jan-April 2015 students participating in an Information Visualization MOOC hosted by Indiana University looked at participation for all T/MC conferences from 1994-2011 and began creating some participation maps. Click here to read the story and see the report produced by this team.


In the past couple of weeks I've participated in events that connect people from around the world, and throughout the US, via Twitter and live streaming video, and traditional face-to-face settings. These included the Global Cities Summit and the Independent Sectors Threads events. As I've participated in these events, now, and in past years, my first question is "Why aren't they mapping participation" using GIS maps and Social Network Analysis?

My second question is, "How could we influence more people to do this?" In many of these there is a lot of talk about collaboration, sharing ideas, and working together to solve problems. Yet, when I visit most web sites, the information they share is usually the information they produce. Few point to information of others, such as I do from Tutor/Mentor Connection and Tutor/Mentor Institute, LLC web sites.

I created a new concept map today, pointing to organizations who are mapping data to show indicators of need. Creating a visual understanding of where poverty is most concentrated, or where water is most scarce, can help mobilize attention and focus more people on possible solutions. Instead of just pointing to your own maps, why not point to maps and data available on dozens of other platforms. That's what I do.

Drawing more users to these data sites, and teaching more people to create map stories that increase understanding and expand the number of people involved, should be a strategy of all of these different organizations. Using maps to show who is participating, how often they participate, and who is still absent from the conversation, could be part of a long-term coalition-building strategy intended to draw more of the talent and networks needed to raise funds, increase votes and build and sustain solutions in the different areas that maps highlight as areas of need.

Sunday, June 7, 2015

Mapping Foreign Aid. Who Gives? Who Gets?

This map is from a data platform called d-portal.org, which is collecting and mapping data on foreign aid given by US and other countries. This article on FastCompany.com provides an introduction.

This is an exciting use of data and mapping.

I'd like to see someone build a tool that offers the same features, but maps cities throughout the US and shows aid to poverty neighborhoods. Click on the Philanthropy tag and see some sites I've pointed to who are beginning to do work mapping donations in the US.

Visit the Tutor/Mentor Institute wiki section on uses of maps. If you're interested in supporting our own goals, let's connect.

Wednesday, May 13, 2015

Big City Poverty - Baltimore not Alone.

This image is from this Brookings report article, titled "Good fortune, dire poverty, and inequality in Baltimore: An American story".

It shows that the conditions of inequality and concentrated poverty that contributed to the Baltimore riots this spring are present in many major US cities. To me, this means each city should have a Tutor/Mentor Connection strategy, which is outlined in the concept maps shared in articles on this blog, and on pages of the Tutor/Mentor Institute, LLC web site.


This map shows a long-term commitment every leader in a city needs to adopt, and demonstrate in their actions. If you follow the lines on the concept map, the line in the center points to this four-part strategy, which supports the involvement of leaders with information they can use to reach youth and families in all high poverty areas of any city.

Friday, May 1, 2015

Solving Poverty. Who Needs to Be Involved?

If you're trying to build a team to solve a problem, you need to attract people who have the talent and skills needed, or who can recruit others who have needed skills. I've created concept maps and visualizations such as the one at the left to serve as a worksheet that I and others can use to recruit needed talent.

Building this team requires a constant process of invitation, via social media, newsletters, one-on-one networking, etc. Unless you are able to fill key talent roles, you end up doing necessary work on your own. If you don't have needed talents, you struggle.

I've hosted Tutor/Mentor Leadership and Networking Conferences in Chicago, every six months since May 1994. The goal is to attract people with talent, skills and civic reach who will help volunteer-based tutor/mentor programs grow in all high poverty neighborhoods, as part of their own commitment to reduce poverty, improve opportunity, fill workforce needs, etc. See how maps can be used by reading other articles on this blog.

In an effort to help people who attend connect with each other I launched an on-line attendee list in 2007. I started using GIS maps a couple of years ago to show where people came from, and what group they were part of (business, philanthropy, programs, etc.) In 2010 an intern from DePaul University use a Social Network Analysis (SNA) tool to create maps showing participation in 2008 and 2009 conferences. You can read her map-stories here.

I've not had consistent talent to do this work so was delighted when invited to be a client for a 2015 Information Visualization MOOC hosted by Indiana University.

The team has finished their work and this is one visualization that was created. You can see it and other visualizations in this final report. I encourage you to visit this page on the Tutor/Mentor Connection forum to learn more of this project and see work that was done.


Why is this important? As a nation we are not very good at pulling people together and building a long-term focus on solving complex problems. Read more.

While my organization has always been small, it's even smaller since 2011. Thus, the few people I can gather at Tutor/Mentor Conferences are a small sample of the talent and networks who need to be supporting the growth of mentor rich programs in all poverty neighborhoods of the Chicago region (or other cities), and helping kids in these programs move through school and into jobs.


My goal is that organizers of other events focused on the same issues begin to follow my example, and create maps that show who's participating, what neighborhoods are represented, and who else needs to be involved. If you're already doing this, share your maps; connect your network. By mapping participation over many years, which is what I'm trying to show since I've been hosting conferences since 1994, we should be able to show if people are staying involved, or if involvement grows over time. This information should lead to more support for those who do this well, and more lessons for others who need to do it well.

My next conference is Friday, May 8 and it will have a small turnout.. unless readers share this and encourage others to attend. If you'd like to work with the same data the IVMOOC students were working with, and create more maps and analysis of the Tutor/Mentor Conferences, please contact me.

Visit the Tutor/Mentor Institute Blog and read more about network building, complex problem solving, etc.

Tuesday, April 28, 2015

Mapping Strategies in Response to Baltimore Riots

It was easy for me to do a Google search and find a map showing the widespread rioting in Baltimore.

I did a search to find a map showing tutor/mentor programs in Baltimore, and while I found program lists hosted by Johns Hopkins University and by the Montgomery County Network of Care, I did not see a map showing where existing programs are located, or being used to mobilize leaders to help mentor-rich programs grow in all high poverty areas of the region.

I posted a blog article this morning showing how cities like Chicago and probably others have never had a comprehensive battle plan to distribute programs, resources and opportunities into the high poverty areas of their cities. I also focused on this in the eMail newsletter I shared today.

I've been piloting a map-based tutor/mentor program locator since 2004, which not only shows where existing tutor/mentor programs are located, but breaks this down by age group served, and type of program. It also includes layers of information showing indicators of need, such as poverty and poorly performing schools. And it shows who should be helping (assets), such as banks, churches, universities, etc. It even has layers showing political districts.

I posted this 1998 presentation on Slideshare this week, showing work I've been trying to do in Chicago to support the growth of mentor-rich programs in all high poverty neighborhood. The map-directory is just one part of a comprehensive on-going strategy....which never has been consistently funded or supported by civic leaders in Chicago.

I encourage leaders in other cities to consider this as a NEW idea which they could implement with much greater impact than I've had in Chicago. I'd also like to find volunteers, partners and benefactors who'd help me upgrade the program locator and other projects I'm working on.

I noticed that Johns Hopkins University Hospital is in the middle of the riot area. In the 1990s they were the lead hospital in a Hospital Youth Mentoring Network. I attended a conference they hosted in 2002 and they attended the Tutor/Mentor Conference a year earlier. I'd like to connect with someone who'd bring the Tutor/Mentor Institute into the university, where the ideas I've been building for over 40 years can be taught to a generation of future leaders.

Monday, April 20, 2015

15 US Cities Where Poverty Growing Fastest

This map is from a Brookings.edu 2014 research brief, titled "The Growth and Spread of Concentrated Poverty, 2000 to 2008-2012".

Every circle on the map represents a community that could adopt the Tutor/Mentor Connection strategy, supported by the Tutor/Mentor Institute, LLC.

Another use of Interactive Map - Food Insecurity Map

One of the goals of this blog is to showcase innovative uses of maps which could be duplicated in efforts to support the growth of youth tutor, mentor and learning programs in high poverty areas. Visit this link and browse the Feeding America site and Food Insecurity map.

Wednesday, April 15, 2015

Black Male Achievement Funders Map - Excellent!

If you browse articles on this blog and the Tutor/Mentor Institute, LLC blog, I've posted maps that show where volunteer-based tutor/mentor programs and other forms of learning support are needed, based on data like poverty, poorly performing schools, violence and health indicators. In a few articles I've indicated a need for maps showing where funding was being distributed, so more organizations and activists could use that information to encourage continued funding where it is now landing, but to increase funding in areas where more, or better, tutor/mentor programs are needed.

Thus I'm really pleased to encourage you to look at the Funders Map posted on the BMAfunders.org web site. BMA seeks to support organizations that offer Black men and boys in the U.S. greater access to the structural supports and opportunities needed to thrive. Thus, this map focuses on funding of those types of organizations.

I encourage you to browse the map and learn to use it. Read this Forbes article to learn more about funding of BMA programs.

If you zoom in you'll see grants distributed in some neighborhoods but not available in others. I'm not sure if this platform yet has the functionality of the Tutor/Mentor Program Locator, which enables map views (see right) to be created that show existing tutor/mentor programs in high poverty area. However it has a level of visual excellence that the Program Locator does not have and it has captured donor information, which the Program Locator does not do.

In the Forbes.com article is this quote: "George Soros, founder of Open Society Foundations, noted in the 2012 report, “this is a generational problem. It demands a long-term commitment.” I'd like to see an army of "story tellers" using this platform to educate donors and policy makers so the commitment and flexible operating funds are continued for a decade or two, and extended to every high poverty neighborhood (and to other minorities and girls).

I think more can be done.

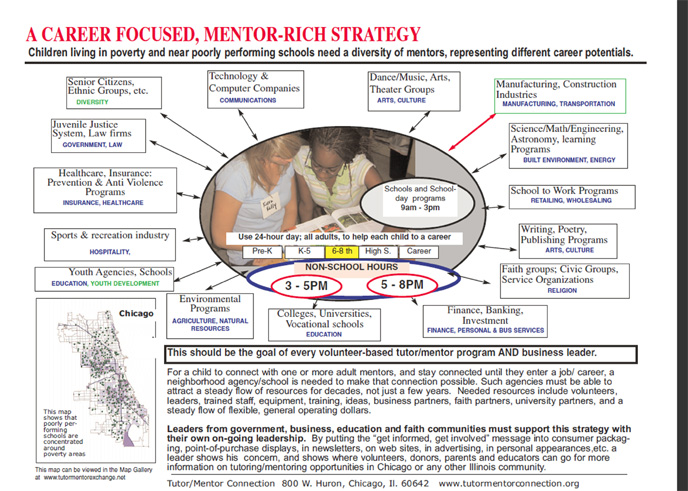
What I feel needs to be created are a set of maps. First, concept maps need to be created that show the supports youth in poverty need as they move from pre school to jobs and careers. This map is an example.


Depending on the level of poverty, segregation and isolation in a neighborhood a child will need more or less of the supports shown on this map, and they need them starting at preschool. The nodes on this map have the ability to link to web libraries which contain links to web sites related to each node. Thus, people interested in learning about technology programs focused on middle school youth should be able to look at web sites of organizations already doing that work, or showing who funds that work.


If the blueprint shows the types of youth serving organizations needed at each age level,the map should show organizations doing that work, and what neighborhoods they serve. Thus, if tutor/mentor programs for middle school kids are important, you should be able to search the map to see if such programs are available in all high poverty neighborhoods, and if the are being funded by multiple donors.

You should also be able to look at program web sites and see blueprints like the one above, with highlighted areas showing what part of the work each organization is doing.

The Tutor/Mentor Program Locator was designed with this level of functionality. Thus you can look at layers of information, showing locations of various types of tutor/mentor programs, by elementary school, middle school and high school service levels.

I've not had funds to update the Program Locator's technology or data since 2009, yet it still represents a useful resource. I was able to create these map stories, using it. However, unless I can find partners and resources to improve the technology experience, and update the data, this will become a great vision, but useless tool.

I've reached out to BMA and similar groups to introduce my work, and to invite partnership. This has not yet led to anything where I could say "my ideas are included in their work" and their "network is supporting my work".

I'll keep trying. I'll also keep pointing to good work being done by others.

Wednesday, March 4, 2015

Mapping college locations in relation to poverty

This map is one of a series of maps showing poverty in Illinois, and showing locations of colleges. You can see the map in this article, titled "Location, location, location: Are top universities too far away from low-income high school graduates?" The maps for the article were drawn from this report, titled "Optimal Spatial Distribution of Colleges" which includes similar maps for all 50 US states. Illinois is on page 42.

In this 2008 Mapping for Justice article you can see that the Tutor/Mentor Connection has consistently used maps to encourage colleges and hospitals to build strategies that support the growth of mentor-rich non-school programs in the neighborhoods where they are locate. This article on the Tutor/Mentor Institute blog has the same goal.

Wednesday, February 25, 2015

Intermediaries focused on youth in Chicago

Since October 2014 I've been posting articles showing uses of concept maps. They are a different form of information visualization than the geographic maps posted since 2008.

The map at the left shows intermediary organizations who focus on the well-being of youth in the Chicago region. Some of the nodes are empty, such as ones focused on "business, universities, philanthropy and faith networks". What this means is that someone needs to build a similar concept map, showing what organizations within these categories are doing to support programs helping youth in different parts of the Chicago region.

Most of the nodes on the concept map have links to the organizational web site. I encourage readers to look at each web site to see what they are doing, and to offer your support if possible. As you do, look for visualizations that show a commitment to helping youth move through school and into jobs and careers, such as mine at the right. If a growing percent of all of the intermediaries focusing on youth shared the same broad goal, each could then define their own focus area, such as making STEM programs available in non-school hours, or arts programs available during school day hours.

I'd also look to see if each intermediary has a resource section where they include maps like this, and where they point to others who are working to help youth in the region. At minimum they should point to a list of organizations within their own sphere of influence, like the Chicago tutor/mentor program list that I host.

I created this graphic (see article) to illustrate a need to not only influence what service providers do to help youth, but to illustrate what resource providers need to do to assure that every service provider, and intermediary, has the talent, tools, dollars, etc. to do the work that needs to be done, and to keep doing it, and getting better, for many years.

I feel this should be a shared goal, and responsibility, of every intermediary, and every service provider. If we're going to reach youth in every high poverty neighborhood with programs that help them move from first grade to adult roles, responsibilities and jobs and careers, we need to influence the distribution of resources and the growth of needed programs in all high poverty areas of the city and suburbs.


I've hosted a Tutor/Mentor Leadership and Networking Conference in Chicago every six months since May 1994. I've invited leaders and staff of these intermediaries to attend, and to use the conference as a meeting place for their own networks, while also using the conference to help build visibility and draw needed resources to themselves, and to all of the organizations they support. If you look at names and organizations shown on conference attendee lists that I've used since 2007, or the conference maps that I've begun to create, you can see that there still is a great deal of work to be done to bring these groups together consistently.

I recognize that it's possible that someone else is having more success bringing these groups together and has been doing so for the past 20 years. If so, I would hope they would have some maps and attendee lists that show who is attending their events. I'd also hope to receive an invitation, and have my web sites serve as a resource for all of them.