Showing posts with label philanthropy. Show all posts

Tuesday, May 19, 2026

Mapping Philanthropy in USA

Below is a view of an interactive map that can be found on the Smart Charity website.  This shows the amount of philanthropic grants received, per person, in 2021 for each county in the USA. 


Below is another view from the same dashboard.  This one shows counties with high poverty but lowest philanthropic support per person.  You can click on the map, or the table at the right, to find data for each county.


I introduced the Smart Charity website in this January 2026 article on the Tutor/Mentor blog. It's part of a Project 990 program at the University of Indiana and one of a growing number of sites that I'm seeing that are using IRS 990 data to create interactive maps like this. 

Below is an image from another story on the Tutor/Mentor blog. 


This is the first page of a visual essay where I show the number of youth, age 6-17, who are below the poverty level, in each Chicago community area.  An example is shown below.  The yellow boxes show numbers from 2011 and the blue boxes show the same information, but for 2018.


If you use the Smart Charity dashboard you can zoom in to Illinois then put your curser over Cook County. You'll see that philanthropy gave $534.43 per person.  That's for 5.177 million people.  With the growing abilities of AI I'm hoping that future dashboards will zoom to the zip code, census tract, and/or community area level, giving a much better understanding of philanthropic support in big urban areas.

If you're finding dashboards like this please share the links in the comments, or connect with me on LinkedIn, Twitter, Instagram, Facebook and/or BlueSky to share the links.

I hope you value this information and that some will visit this page and make a contribution to help me pay the bills.  Thank you.


Wednesday, April 16, 2025

View my concept maps

Below is one of the first concept maps that I created, back in 2005, to visualize the ideas I was sharing in my blog articles, e-Mail newsletters and website.

I wrote about these in a series of articles posted on this blog in 2015.  


I use cMapTools to create my concept maps.  It's easy. It's free.  Each map has nodes that are connected by lines and arrows, so you can "read" the map to understand what it is offering. 

At the bottom of each node are two small boxes.  The one on the left has links to external websites.  The one on the right has links to additional concept maps.  Thus, you have layers of connected ideas.

A few years ago I created a page on my main website where you could see, and open, all of my concept maps.  That site has been down for repairs for a few days so I decided to add lists of cMaps to the concept map shown below.


At the lower left you can see how a single node might include several maps.  I encourage you to make a visit and just open the links in each node, to learn what types of maps are available.  Later you can dig deeper into any single map that interests you.

In my concept maps I embed many geographic maps showing areas of high poverty in Chicago where volunteer-based tutor, mentor and learning programs are most needed, and where current programs are located.


These maps intend to draw volunteers, donors, media, youth, parents and others to programs throughout the city, not just one or two high profile programs.  They also are intended to support a planning process that identifies where more programs, or specific types of programs, are needed, and who could be helping such programs grow.

I encourage people from other places to use my maps and blog articles as a starting point for creating a similar collection, focused on their own city/state.  Then share your maps in blog articles and on social media like I do.  

Together we might draw more attention to this information than each of us can by ourselves.


That leads me to this post on the Tutor/Mentor blog.  It features an article by Vu Le, titled "Funders, here's the blueprint for saving democracy."   

I urge you to read it.  Then, you could create a concept map that visualizes the steps he writes about, and share this in your own blog article with philanthropic and business leaders in your own area.

Share your articles on social media and I'll boost them as I see them.  

Thanks for reading. I look forward to connecting with you.

Sunday, October 8, 2023

Pain and suffering around the world

Today I'm listening to news about the brutal terrorist attack in Israel, following the continuing Russian attack in Ukraine, and looking at headlines about kids killing kids in the USA.  

It's overwhelming.

A few years ago I posted a map showing disaster areas throughout the world.  Today I looked for updated information and found this detailed map on the Visual Capitalist website.


The Reliefweb website also has a map showing disasters around the world.  

As I look at the scale of these conflicts and natural disasters I ask, "How can I keep trying to help kids in  high poverty areas connect with tutors/mentors in organized, on-going non-school programs?"  That seems like such a small issue compared to these larger conflicts and disasters.

This is not a new concern for me.  Below is a graphic I created in the 1990s. 


This shows a goal of attracting a small percent of attention and philanthropy to youth tutor/mentor programs on a regular basis.

Below is another graphic that I created to show the need to divide attention and giving into slices of a pie so that a small percent goes to on-going problem solving, like helping kids entering 1st grade today be entering jobs/careers in 12 to 20 years.

Here's another. It uses the pie chart from the graphic shown at the top of this page, to emphasize how every non-profit youth program competes for a small, inconsistent, pool of donor dollars.


My goal has been to draw youth serving programs together in an on-going campaign that educates donors and increases the size of the pie, and motivates them to look for 1) where tutor/mentor programs are most needed; 2) choose a zip code you want to help; 3) look at websites for programs in that area to see what they do and what help they need; 4) then look in a mirror, and decide how, and how much, you want to help.

While we need to give attention to disasters and conflict around the world, and in America, we need to continue to devote a small slice of time and dollars to helping kids grow up safely and well-prepared to be leaders in their adult lives. 


Monday, March 21, 2022

Build Data Dashboard using ESSER funding.

Last week I watched a webinar where the term Social Determinants of Education was used in context of the non-school data schools could be collecting to better understand school performance and propose solutions.  I wrote about it here and included links to the video and website, along with other resources.

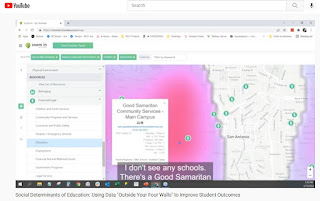
Below is a screenshot from the demonstration shown in the video. This shows how non-school youth development programs are plotted on a map along with indicators such as poverty. 


In my article I showed how the Tutor/Mentor Connection (1993-present) had started building a list of Chicago non-school, volunteer-based tutor/mentor programs in 1993 and began using GIS maps to show where programs were needed and where more were located as part of that strategy. 

Read this article to see growth of our mapping strategy since 1993.  Visit this page to see current status. 

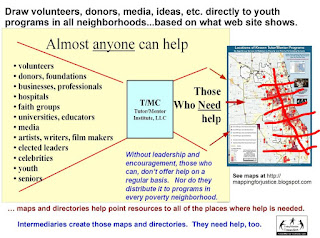
What I did not emphasize enough was that while we pointed to youth serving organizations and indicators of need, we also pointed to businesses, faith groups, colleges, hospitals, banks, etc. who shared geography and could be directly involved in helping fill a neighborhood with a wide range of K-12 tutor and/or mentor programs.


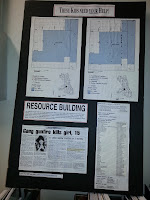
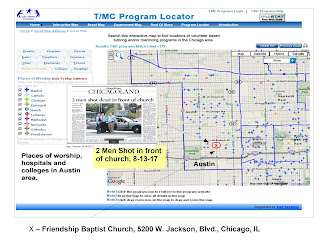
Click on this image and enlarge it, then look at the list posted on the right.  This is how we were sharing information in the 1990s, prior to the Internet.  

It's part of a "Rest of the Story" strategy that we developed to draw additional attention and resources to neighborhoods featured in negative news stories, such as kids getting killed in Chicago.

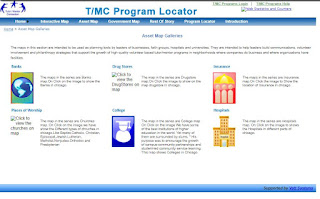
When we launched the interactive Chicago tutor/mentor program locator in 2008 we built a page of asset maps. You can see this in the graphic below. This is only available as an archive now (click here). 

When this was working you could click on any of the categories and open a new page. 

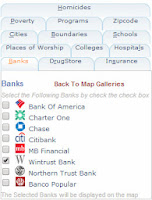
For instance, of you opened the "banks" page you'd find a list of 
Chicago banks. You could build a view showing only one, or several banks. You could also add information from the other categories.  Then you could zoom into a zip code, or Congressional district, or any small area on the map, and see indicators of need, existing programs, which you could sort by age-group served and type of program, and assets.


Below is a map view created using the assets map section:


This shows how I was able to zoom into a section of the city and build a map view, then add an image from a May 2017 newspaper story about "two men shot in front of a church". 


You can find many map-stories on this blog, and the tutor/mentor blog, showing similar map views. 

While this service is no longer available, it remains as a model for people building new dashboards.  Until that happens, I've shown some ways to use other dashboards.

The map view below is shown in this article. I used the Chicago Public Schools Locator platform and zoomed into an area on the far South Side of Chicago with extensive poverty, but too few non-school youth support programs. I highlighted on the map businesses nearby who could be helping.


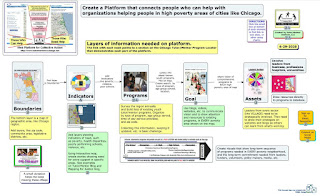
For those who have the funds (perhaps from ESSER) to build new dashboards I created this concept map to show layers of information that could be included.  See it in this article. 

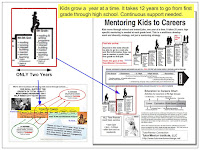
What my maps and articles focus on is funding and sustainability. It takes 12 years for a youth to move from 1st grade to high school graduation and several more years to move into a job.  While a few non-school organizations may succeed in attracting consistent funding, most don't have that type of ability. They struggle. 

If someone can create an interactive dashboard, and someone else can build a list of non-school youth serving organizations, sorted by type of program and age group served, others can integrate this into the dashboard and lead efforts to draw 'people who can help' through the dashboard and into different parts of the city, and the websites of organizations in those areas.


In the graphic above I've drawn a grid over the map of Chicago illustrating the potential for volunteer groups, businesses, faith groups, etc. to adopt specific parts of the city, collecting and maintaining program data for that section of the city and leading on-going communications and outreach efforts intended to draw support to youth programs in that area.  The could also be supporting the operations of programs in that area and/or making specific types of learning more available, such as computer science education. 

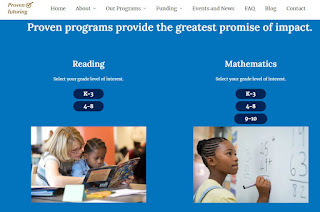
Ultimately, every high poverty area should have someone taking this role.  That takes me to another innovative project.   This is the Twitter page of Proven Tutoring. It's a project of the Johns Hopkins University Center for Research and Reform in Education. 


Visit the website, read the blogs, and view the list of reading and mathematics tutoring programs that they point to.  


This is an example of what universities could be doing to collect and share information about non-school tutor, mentor and learning programs in neighborhoods surrounding each university.  I've been reaching out to universities since the late 1990s to enlist one, or more, to take this role in support of the Tutor/Mentor Connection's strategies. Here's one example.

Proven Tutoring is partially funded by the Walton Family Foundation.  Just last week I saw this Tweet, showing a $281 million gift from @MackenzieScott to fund the Boys & Girls Clubs of America.   
Imagine the potential for a major donor to fund the one or more universities adopting the Tutor/Mentor Connection strategy and goals and hiring a team like that at @RS21 to build a data platform that has all of the Social Determinants of Education features that they described in their webinar and in this blog article, along with layers of information showing youth serving organizations, and assets, which was collected and updated by students. 


Imagine the even greater potential if students in business, arts, sports and media departments were leading on-going campaigns to draw policy-makers, volunteers, donors, youth, educators and others to the platform and on to websites of youth organizations, who they then would support with time, talent and dollars.

That's the goal.

If you're still reading, thank you.  Please share this with your network and with people who can take up this call to action. 


Thursday, June 17, 2021

Thoughts about Maps

Since 1993 I've been trying using maps to help people form "partnerships and connections" that lead to a greater and more consistent flow of resources into every high poverty area of Chicago. One result would be a broader range of K-12, non-school, tutor, mentor and learning programs.  

Maps can be used to focus attention on places where people in Chicago need extra help. They provide answers to questions like “What neighborhoods are affected?” And, “What indicators show these areas need this government and philanthropic support?”

Below are some examples of how maps can be used. In this case I'm focusing on the Opportunity Zones announced in January 2019. 

The Opportunity Zone map is shown at the right in the following graphics. In the first map I've used a demographics mapping site  to show Chicago. The green color shows areas with a high density of African Americans. By comparing the O-Zone map with the one on the right, you can see that the Opportunity Zones are targeted to help this sector more than others.


This next map shows the Chicago Tribune “shootings tracker” site, which shows locations of Chicago shootings for past 365 days. There's a definite overlap with O-zones but there are other areas which also need investment.


The next map comes from the Casey Foundation's Community Opportunity Map which shows poverty levels in Chicago (and other parts of the country). Using the interactive map you can focus in on specific parts of the city, and generate tables of information. For instance, I created a view focused on the North Lawndale area.


This next set of maps shows non-school youth tutor and/or mentor programs in Chicago, based on a list I've been maintaining since 1994. While most of these are not-profit centers that would attract Opportunity Zone investment, they are part of the mix of youth and family support organizations needed to help bring a neighborhood out of deep poverty.

View Tutor/Mentor Programs map here

A closer inspection of my map would show the wide range of programs on the map, and the lack of these programs in many of the O-Zone areas.

So who are some of the potential stakeholders and resources already in these neighborhoods?

On the graphic below I've zoomed into the O-Zone map to focus on the North Lawndale area of Chicago's West side. Then, I used the Chicago Health Atlas Map to focus on North Lawndale, and show hospitals serving this area.


Hospitals can be employers, can be customers for products and services produced locally, can provide needed health services, and can be conveners who bring stakeholders together. They can also be leaders who help comprehensive youth tutor/mentor programs grow in the area. Using the Chicago Health Atlas you can also create maps showing health disparities, which are indicators of investments needed in different areas of Chicago.

In the concept map below I point to the platforms I used to create the maps I've shown. These are just a few of the growing number of data mapping resources becoming available over the past few years.

Open map at this link

Creating, maintaining, and motivating others to use these platforms offer many challenges. Among these are:

a) Motivating and teaching people to use the various platforms to create maps that focus a story on specific places. That's what I did in the above maps.

b) Locating the different platforms with needed information can also be a challenge, at least from a time perspective. In many cases the data-maps are no longer on-line, so when I open a link it is a dead end. Unless people are really motivated, most won't do the digging needed to put together an effective map story.

c) Building public awareness so more people look at the maps, use them in planning and action steps that bring people together and drive needed resources to non profits and growing businesses in specific areas is also a challenge. People creating the map platforms usually don't have advertising dollars to do the communications needed to attract people to the maps, or to teach others to use the platforms to create on-gong map stories.

These data resources are not profit centers. Thus, they don't qualify for investment zone capital. One role of philanthropy, or other government resources, could be to support the development, constant maintenance and updating, and long-term use of platforms like this.

There are already a variety of community planning resources. Why not use them to guide investment? LISC Chicago as an example of this.


Below is a screenshot is from one of 27 quality of life community plans developed under the lead of LISC Chicago. It shows the Austin Community area. All 27 can be downloaded at this link.

Download at this link.

I don't include it on my data map because it's in a PDF, and not an interactive, on-line map (according to LISC Chicago). Thus while it's a great map, it's only useful to those who have access to it. You can't add layers, or zoom in, to focus on specific areas, or turn it into stories. There may be other map platforms like this in Chicago, or in other cities. I'm always adding to my library and this concept map. Send me links if you have them.

Another resource that can be used is the Chicago Public Schools Locator map. Below is a screenshot that I created using the CPS Locator platform. I shared it and others in this blog article.


In my own efforts between 1994 and 2011 I tried to build one platform that would provide many layers of information that could be used to support neighborhood based planning intended to make more and better youth serving programs available in high poverty neighborhoods.


The map of the left was created using  the Interactive Tutor/Mentor Program Locator's Asset Map section. (It's no longer functioning properly, although still can be seen on-line archive at this location.)

While I've been collecting and mapping data since 1994, for most of those years I was dependent on volunteers and donated software. In 2007 a $50k anonymous gift, combined with a grant from HSBC North America, enabled me to re-build our in house mapping platform, and to build the on-line interactive platform.

Using ARC GIS software we could create maps showing layers of information and using the interactive platform, we enabled others to create similar maps. Below are two examples. You can see more like this in the MapGallery created in late 2010.


Unfortunately, the recession, starting in 2008, dried up funding for this by mid 2010.  I've not had funds to update this or create these maps since 2011, and it would take a significant investment to rebuild my capacity.

Yet, I feel it is needed because I don't find any other mapping platforms combining all the layers I was trying to combine, and building it into blogs and on-going communications, so community planners could show the need, show existing service providers (and/or businesses) and show assets in, and around, the community who should be involved in any planning process.

I wrote an article last year showing the layers of information needed on a platform like the Tutor/Mentor Program Locator - read it here. 

I also added an interesting article about building relationship networks to support philanthropy. You can read it here.  Such networks could be using the mapping ideas I've been sharing.

Last year MacKenzie Scott made a massive contribution to help fund 116 organizations (see here list). This week she did it again, and one of the recipients was MENTOR, The National Mentoring Partnership.

Following last year's announcement I created this graphic, with the goal that she and others would make a long-term commitment to support the growth and operations of well-organized, long-term, tutor, mentor and learning programs helping kids in poverty from birth to work.  Maybe the MENTOR gift is a partial response. 


Thus far I've not seen MENTOR or any other youth development organization use maps the way I've been, in an effort to draw funding and volunteers into every high poverty neighborhood.  Thus, if you're  researching places where you can make a difference, perhaps you can read some of the articles on my blogs then share them with others who might want to become the investor, partner or benefactor who rebuilds the Tutor/Mentor Connection and its on-line mapping, and makes it freely available for others to use in Chicago and cities around the world.  

Or, you might be a creative social entrepreneur who can figure out how to generate revenue and profit from this, so we could seek capital investors from programs like the Opportunity Zones program.

I'm on Twitter, Facebook and LinkedIN. I'll look forward to connecting with you.

Saturday, April 24, 2021

Chicago Philanthropic Initiative Using Maps

If you skim through articles on this blog you'll see that I've piloted uses of maps to guide the distribution of resources to youth programs in high poverty areas of Chicago  since 1993.

The Tweet posted below points to a WBEZ article pointing to The Mapping COVID-19 Recovery Project, a collaborative effort of 25 major Chicago foundations, nonprofit organizations, and public and private groups.


WBEZ is doing some outstanding mapping. It's an example of what's possible if you have the talent and dollars needed to create the maps and share them via various media channels.  I encourage you to read the report, visit the Recovery Project website, then help draw attention to the places where the maps show people need extra help.

Wednesday, August 12, 2020

Using Maps for Planning Grant Making

 I've posted several articles showing my goal of having maps used strategically in deciding where grants are distributed with a goal of coaching a better flow of operating and innovation dollars to normally neglected areas.  When I've seen a promising practice I point to it with an article and a link. Sadly, that's not too often.

However, here is something that I saw today that looks promising.  The description provided on the web site says: "The maps on this site are part of the COVID Response Dashboard, developed by the Center for High Impact Philanthropy in collaboration with Philanthropy Network Greater Philadelphia. They include grant award data from participating funds serving Southeastern Pennsylvania and Southern New Jersey."

This platform focuses on the greater Philadelphia area and on grants focused on Covid19 relief and seeks to show where funding is being distributed and where more is needed. That's a planning tool that is needed for other categories, such as youth serving organizations. 

Below is the dashboard, described as a "Strategic Planning Tool" that was created to support this project.  I'm working on an older PC so this kept crashing on me as I tried to use it, so I hope others have better luck. However, the interactivity shows excellent potential.

This platform was created by Urban Spatial, a firm located in Philadelphia and led by Ken Steif, who I met on Twitter. Browse the website to learn more about what Ken feels is the potential for using platforms like this.

My goal for 25 years has been to host a platform like this, with several layers of information. We created a version of this in 2008 when a team from India built the Chicago Tutor/Mentor Program Locator (which is now only available as an archive). 

Across the top you can see tabs opening different resources and at the left you can see tabs that represent different layers of information.  You can zoom into this and create maps focused on specific areas of Chicago, as shown by the map below.

This shows levels of poverty, locations of poorly performing schools (from 2007 or 2008), locations of non-school tutor and/or mentoring programs, and locations of assets who could help programs within a geographic area do more to help kids.  Assets would be banks, churches, colleges, hospitals, insurance companies, etc.  

I posted a blog article a few weeks ago showing layers of information needed on a platform like this. 

The platform showing Covid19 funding in Philadelphia shows additional types of information that could be layers on such a map, and a dashboard that might help people use it better.

Building a platform like this would provide a tool any one in business, philanthropy or government could use to mobilize and distribute resources into high poverty areas, supporting the growth of a range of birth-to-work programs, which I've described in these articles. 

The Chicago Program Locator is now out-dated and I've not been able to update it since 2013. However it still works and demonstrates what's possible.

I don't have the talent, or funds, to build and/or manage such a platform. but I've built a platform that models what's needed and a strategy that collects information and and shares it regularly so more people use the platform to support youth program growth throughout Chicago. Thus, I'd be an ideal partner/consultant to someone who has the vision, commitment and resources to build an updated version.

I'm on social media at these places. Let's connect. 

9/14/2020 update - Philadelphia looks to be using maps in creative ways. Visit this Rebuild Philadelphia page and view the data maps. 

Wednesday, November 1, 2017

Mapping Philanthropy - Where's the Analysis?

BMA Funders Map
The map at the right is from the Black Male Achievement web site and shows grant making focused on men and boys of color, and Black men and boys in specific.  It's a great resource and I hope more donors and recipients find ways to show this type of information.

I wrote about this in 2016  and have written other articles on this blog and the Tutor/Mentor blog, focused on philanthropy and funding of non-school tutor, mentor and learning organizations that serve youth in high poverty areas.

The screen shot that I posted above shows the level of information available on this site. In this case the number of grant makers and name and number of Illinois organizations who received grants in 2015.

Since I focus on organizations who provide long-term, muti-year support, reaching kids when they might be in elementary or middle school, then staying connected through high school, it's important that funding be repeated to these organizations on an on-going basis, focusing on building strong organizations, not on specific projects or outcomes.

I also focus on high poverty areas where this long-term support is most needed and I use map overlays to show where poverty is concentrated.

Thus, I'd like to find stories showing how people are studying the BMA data, to show if funding is reaching enough of the programs who are doing work in this sector, and continuing from year-to-year.  That might require that more people plot funding on sites with demographic overlays.  I don't think I see this on the Foundation Center maps.

For instance, in 2015, 78 grants totaling $2.9 million were made in Illinois, to nine (9) Chicago area organizations. 63 of these grants went to Chicago Jesuit Academy (49) and Cristo Rey Jesuit High School (14), totaling $2.165 million.  If you look at my list of Chicago tutor/mentor programs you'll find many in high poverty areas serving minority youth. 

This should prompt stories saying "We need more comprehensive funding data!" and/or "We need funding to reach more programs."   I don't know if those stories are being written.

Distressed Communities index
I've written some stories focusing on distressed communities, with maps showing where they are most concentrated. Large numbers of minority youth live in many of these areas, so the foundation giving maps should show a broader distribution of grants than what I see for 2015. 

This broader distribution needs to be happening every year if we want good programs to be continuously operating in more of the places where they are needed.

Who's writing about this?

If you are doing this type of analysis, using BMA Funders data, or some other philanthropy-tracking resource, please share links to your stories so people reading this article can expand their understanding by reading what you are also writing.