Showing posts with label SystemsThinking. Show all posts

Thursday, November 30, 2023

Explore STEM Visualizations for Stakeholder Conversations

Today I explored a robust data visualization site created by Argonne Labs in partnership with Northwestern University’s Digital Youth Network. The project is described on this page.   


Click on any of the green circles and you'll open data tables for nine communities on Chicago’s south side, cataloguing STEM assets from Kindergarten to career.  

2026 update - the links on the Argonne page no longer open, possibly due to restrictions by the Trump administration.  However, you can still view the interactive map, using the link below.

The nine focus communities are shown in the map on the home page.  Open this link and you'll find an interactive version.  Below are some map views that I created in just a few minutes.


Click on the "layers" tab and you will see a menu of choices for what you want to show on your map.  For instance.

This view shows community organizations in the area who offer various forms of STEM learning opportunities.  The orange circles show census data for each census tract in the nine community areas.


In the map view above I've clicked on an icon for the Chicago Youth Programs site at 5350 S. Prairie Ave.  You can see program information in the text box to the left of the map.  This is an organization I've know for many years and is also included in my list of Chicago area volunteer-based tutor, mentor and learning programs.

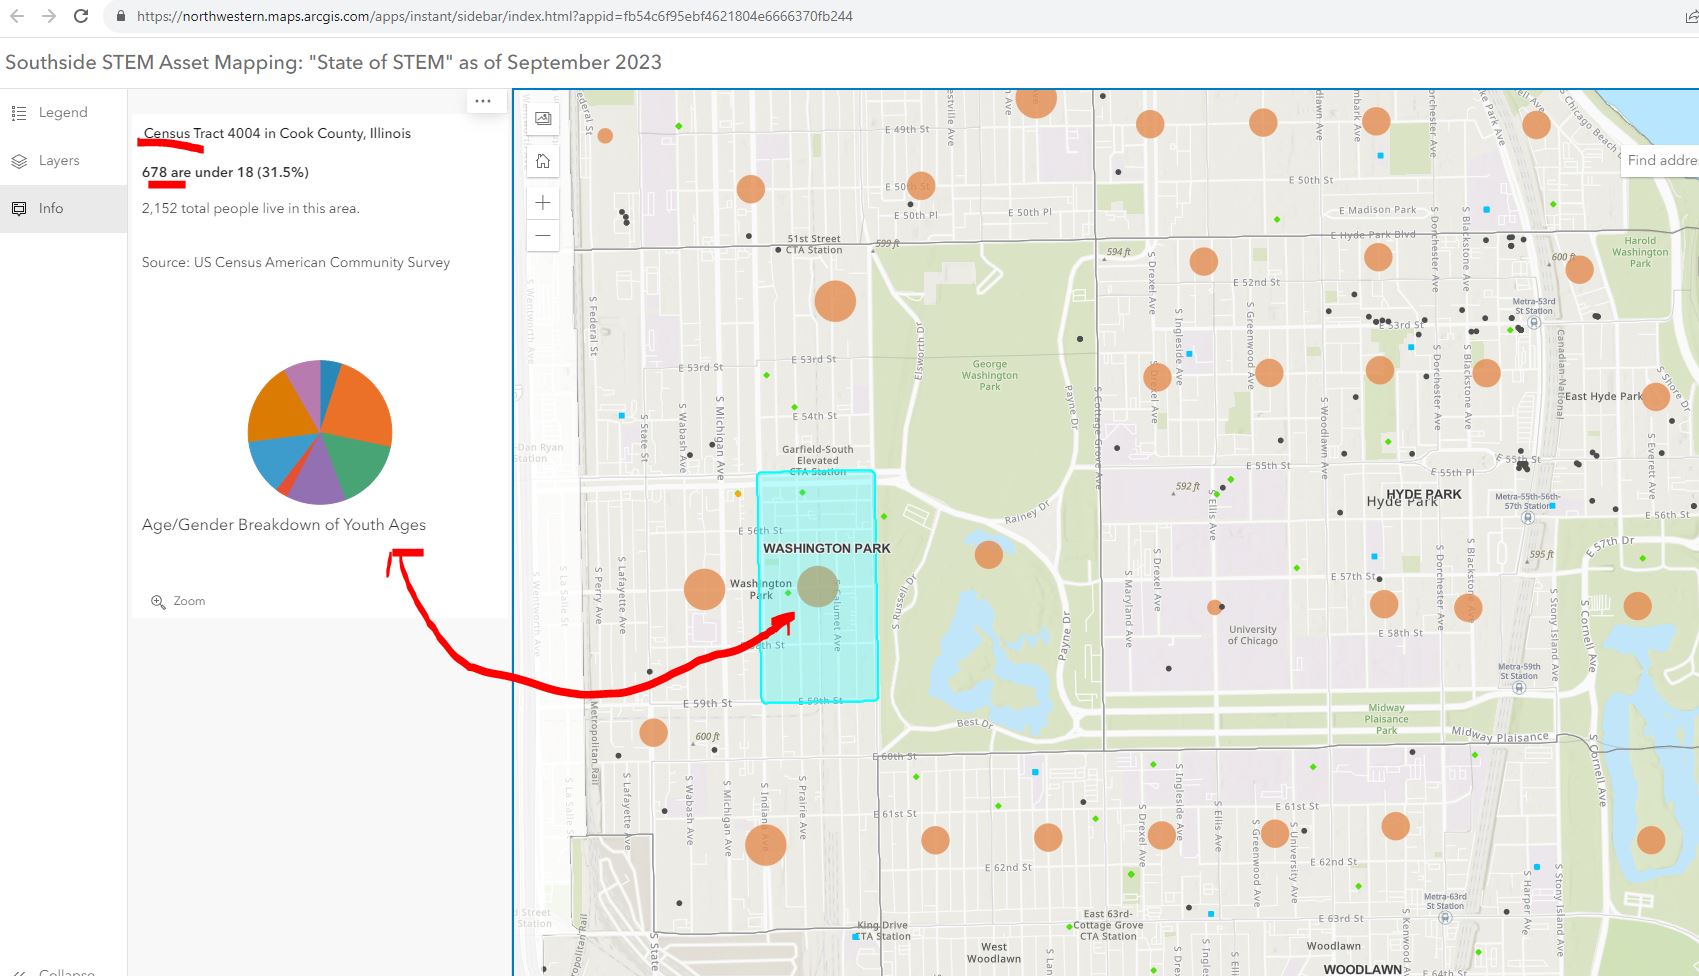
Below is a map view where I've clicked on the orange circle for the census tract with the Chicago Youth Programs location.  I asked for information showing the number of youth under age 18 in the area. The map shows 678 kids out of a population of 2152 in that census tract.


The next map view shows businesses, or potential employers, in the nine community areas.  Put your curser over any black dot and find information showing who that business is. Zoom in to see what businesses are in different census tracts. 


There is a lot to explore.  Here's an article about the platform, posted in the Block Club Chicago publication.

My question is, "How will it be used to make STEM learning and career opportunities available to youth through out the area?"  

I've met in the past two years with the people who created this platform and encouraged them to dig into the history of the Tutor/Mentor Connection and the tools and strategies we piloted from 1993 to 2011 to help volunteer-based tutor/mentor programs grow in the Chicago region.  This Mapping for Justice blog is a textbook for anyone who wants to use it that way. Just read some of the "strategy" articles. 

I started building a list of Chicago tutor/mentor programs in 1993 and at the same time began learning ways to use GIS mapping to show where the programs were located and where more were needed. We published our first Directory in May 1994 at the same time as we hosted our first networking conference.  We used the directory to launch citywide volunteer recruitment campaigns in August 1995.


In 2004 an intern from India built the first on-line Tutor/Mentor Program Locator, which was a searchable database shown below.  We had organized our annual survey in 1994 to learn who offers volunteer-based tutor/mentor programs, where they were located, what age group they served, and what type of tutoring and/or mentoring did they offer, as well as what time of day did they offer services.


The search fields on the Program Locator enabled people to search for specific programs based on the categories of our survey.  This worked like most search engines. If you had an idea of what you were looking for, and where, the platform helped you narrow your search and find tutor/mentor program information in that area.

In 2008 a team from India built a new version of the Program Locator. The home page is shown below. This works differently from Google. It starts with a map of a specific area, then shows layers of information, including our data on Chicago tutor, mentor programs.


At the left you can see layers of information that can be displayed on the map.  These layers included our data about Chicago tutor/mentor programs, but also included poverty data, poorly performing schools, and assets (businesses, faith groups, colleges, hospitals) etc.

Thus, you could create a map showing the entire city.


Or you could zoom in and create a map view showing a portion of the city.  

You could add text to the map to focus on specific organizations in various community areas.


You could follow news stories with map stories. On your map you could not only show existing tutor/mentor programs, but you could add layers showing businesses, hospitals, faith groups, universities who share the same geography and who should be innovative and strategic in helping mentor-rich non-school programs grow in the area. For each part of the city the mix of programs and assets is different.


The Program Locator is now only available as an archive.  However, you can see some of the features in this PDF essay.

How to Use Chicago Tutor/Me... by Daniel F. Bassill

One of the challenges of the STEM project is building public awareness and drawing people to the platform, then teaching them to create stories on a regular basis that draw even more people to the platform and motivate them to take actions that help kids in the area have access to mentor-rich STEM learning programs that provide on-going support as kids move from 1st grade through high school, college/tech school and into jobs and careers.

Since my organization did not have advertising dollars we developed a "Rest of the Story" strategy that followed media stories with maps that showed the neighborhood and pointed to tutor/mentor programs in the area (if any) and described the need for more programs.  Below is a mid 1990s example.


The STEM project leaders could duplicate this and other strategies that I've piloted over the past 30 years.  They are all on-line and available to anyone motivated to look.  They might even add some features and functionality to their platform based on what I have done, or tried to do. 

The Tutor/Mentor Blog is an even broader text book than the Mapping For Justice blog.  Think of the sections below as chapters, or courses in a learning curriculum.  

Public awareness - click here

Using maps - click here

Media strategies - click here

Follow up to violence - click here

Mentor role in larger strategy - click here

Tutor/Mentor Institute, LLC website - click here

The challenge: Too much information.  

View this graphic in this article.  The ideas I share and websites I point to are a vast information ecosystem. It's like a university library or the library of different religious groups.  It can't be learned in a day. It needs to be part of on-going learning.


For that to happen major donors, perhaps MacKenzie Scott, need to provide money to fund programs within high schools and college that provide advance degrees for people who spend 10-20 years learning and applying these ideas.


Thanks for reading. Please share these ideas with leaders in Chicago and other cities.  Maybe you know one of these donors, or are one yourself.

Connect with me on social media platforms and share your own strategies and maps. Help build the network. Help the STEM network grow and reach more people. 

Finally, consider a year-end contribution to help me continue this work in 2024. Visit this page to use the PayPal.  

Thursday, May 4, 2017

Understanding Value of Maps and Systems Thinking

Today on Twitter one of my new followers was Steve Whitla, who's based in Oxford, England. Before I follow back I always look at the types of Tweets someone is posting.  At the top of Steve's page was a TED talk video, talking about the value of maps and systems thinking. I've pasted it below and hope you'll look at it.


As I watched this I saw much that resonates with work I've been doing for past 25 years

Below is one graphic that I've created that I thought of as I watched this talk. You can see an explanation of this graphic in this article.


As I listened to the TED talk, I saw three distinct challenges.

First is the work of collecting information and creating maps.  On the right side of my graphic is a map of Chicago, with overlays showing where poverty is concentrated. I have been building additional overlays showing where non-school tutor/mentor programs are located, with a goal of helping all of them get the resources needed to help kids through school. You can find many stories on this and the Tutor/Mentor blog that include maps that focus on this goal.

There's a significant cost involved in collecting the data for my maps, and keeping it current, and in making maps, or hosting maps on platforms like the Tutor/Mentor Program Locator.  As you watch the TED talk, keep in mind the work and cost involved in creating the mapping platforms that are described. I've never found much money, or consistent talent, to support my own efforts. That's a major barrier to this work.

 Second is the work of motivating growing numbers of people to look at the maps, and use them in the type of reflection and analysis that is described in the TED talk.  On the far left of my graphic is a node that focuses on "building public will".

Step two in the 4-part strategy of the Tutor/Mentor Connection, which was developed in 1993, focused on building public awareness. Finding ways to do this without advertising and public relations dollars is a huge challenge.  While the Internet offered a low-cost way to share ideas with the world back in 1998, it's now dominated by people with dollars to buy attention, or by people who have high visibility, and do crazy things, to attract attention.

Yet, if we don't get enough people interested in looking at this information, and using time, talent and dollars, to support the work of individual tutor/mentor programs, as well as those who collect the information and create the maps, we won't have much success in making good programs available to more kids.

Third is the role of network-builder, facilitator, mentor and teacher. That's the role Steve was taking in his TED talk, and the role I take with my web sites, blog articles, Tweets, and other social media activities.  Someone, or many someones, needs to be making an effort daily to connect people with the maps and information available and help them understand how to use it, and how to apply it to their own life experience and opportunities.

I often compare my maps to "blueprints" that are used by contractors to build buildings.  At every stage of the building process, work needs to be done by people with different skills.  They all need to be paid, or they normally won't do the work and the building does not get built. They also all need to have a certain level of skills, or the building won't stand, even if it does get built.

In solving social and environmental problems facing the world we need blueprints, as Steve is suggesting in his TED talk, and we need resources to support all three stages of this process.

I've been sharing ideas and graphics like this in articles at http://tutormentor.blogspot.com since 2005 and at  http://www.tutormentorexchange.net since 1998. I look forward to connecting with others who are interested in these ideas.

UPDATE:  Here's an article about how traffic accidents are killing 1.25m people per year, and costing 3% of global GDP. The same systems thinking approaches that would apply to helping kids have greater support systems applies to this issue.

Tuesday, March 29, 2016

Mapping Network Growth in Youth Development Field

I created this concept map in the mid 2000s to show a commitment of "helping all kids born or living in poverty in Chicago be starting jobs/careers by age 25" that needs to be shared by many.  A version of this on a web site would demonstrate that commitment.

This map is really an entry point to layers and layers of addition information, representing available knowledge as well as needed strategies that draw people together and generate a flow of ideas, talent and operating dollars to all of the people who are involved in this work in the same neighborhood and/or city.


The map shown above map is an outline of the web library I've been building since 1998, which was really started in the mid 1970s as a paper-based library.

Open nodes on the map and you eventually will get to a list of organizations which you can open to dig even deeper into the information that's available. It's like going to a university. The information available is much more than can be learned and absorbed in a day, or even over many years.  Yet, the more people dig into the information, the broader the range of ideas and strategies they will have to solve problems of poverty, inequality, social justice and workforce development.


Last September I connected with Marc Smith, one of the leaders of a network analysis project called NodeXL.  I wrote this blog article as a tutorial for those interested in learning more about what this is, and why it is important. I wrote another article in February, following the National Mentoring Conference.

Today, I listened to Marc talk to a group of students at Indiana University, via this YouTube video. I hope you'll take the time to listen and to read my blog articles.

In the concept map above and my web library, I point to more than 2000 other web sites. More than 200 of those are youth serving organizations in Chicago.  Others are research organizations, funders, or people who share ideas about collaboration, process improvement, knowledge management, etc. Many of the sites I point to have their own resource sections, thus pointing to even more web sites.  

By hosting this information on the Internet via blogs and web sites, I create the opportunity that on any given day someone from one of the organizations I point to can be digging into the information on my web sites and starting a conversation with someone else.

The problem is, we don't know if this is happening, and how often.  We don't know who is looking at the information, or connecting to us or each other, so we also don't know who still needs to be engaged.

Marc talks about how the #hashtags we use on social media enable us to track topics that people talk about.  He shows how the handle we use, like @tutormentorteam, can be captured using a network analysis tool like Node XL, to create a map showing who was involved in a conversation on a specific set of days, how they were connected to others, if the were, and what type of connectivity is taking place.  

I hosted Tutor/Mentor Leadership and Networking Conferences every six months from May 1994 to May 2015, and one of the goals was to help build relationships between participants, and to connect participants to myself and the library of information and ideas I host. Another was to create an on-line community where more people can connect, and where everyone has a chance to talk and express their own ideas.   Visit this page and you can see what organizations were part of each conference.

So far, I don't see many in the social service field, or in the narrower tutor/mentor field, trying to use maps to show participation in events they host, or in on-line conversations.  I also don't see any who are trying to show impact, by showing network maps of individual youth and/or volunteers who participate in their programs. I've written a variety of articles focused on network building, network analysis and networking that illustrate my ideas, and why understanding who you are connecting to is a critical first step in building the type of network that is needed to build and sustain a mentor-rich system of supports that will help more youth move safely through school and into jobs and careers.


Last week I posted an article, with this concept map, which shows the four part strategy I've developed over the past 20 years, and the work that needs to be done to enhance each step. I posted another article on Monday,  on the Tutor/Mentor blog.  I hope you'll read them, and share them with people in your own network.

I'm just one person with few skills and little funding, but with a broad vision. There's room for many to share this work, but we need to be connected, and we need to be using tools that show how we're connected and that enable others to join in.

By sharing this and other articles I create the possibility that one or more readers will forward this to others, who forward it to even more. One of those people will be the benefactor who endows the work I"m doing and not only provides funding for the next few years, but provides funding that moves this into one or more universities where it grows for the next 50 years.

Using tools like NodeXL we should be able to map this process.


Saturday, November 21, 2015

Using Systems Thinking to understand & respond to Terror Attacks

I've pointed out  uses of concept maps on this blog and written a few articles about Systems Thinking on the Tutor/Mentor blog.  Today I was introduced to a page on the Know-Why-Net web site that is mapping a " Systemic view on terror threats after the 2015 Paris attacks."  Click the link .  

Know-Why-Net before. This visualization of the terror threat and response is just one of many visualizations on the site. I encourage you to visit and build your own  understanding of these tools.