Wednesday, December 24, 2014

High Profile Killings since 1984. Civic Institutions Structural Failure.

Today's Chicago Tribune included a perspective written by Dan Profit, a talk show host on WLS 890. It started with listing the high profile deaths of Chicago youth like Ben Wilson (1984) then jumped to Derrion Albert (2009), Hadiya Pendleton (2013) and Demario Bailey (2014), then said "These are children in Chicago whose gruesome deaths give life to the dreary body-count headlines that bleed over from one day to the next."

The article focused on how media attention is short-lived, and concluded with "In short, Chicago's civic institutions are structural failures. City government has failed. CPS has failed. The Police Department has failed. Nearly everything we have tried has failed." He writes, " We need to contemplate and debate deep, transformative, difficult changes."


I've highlighted these same stories since the early 1990s. There were quite a few high profile stories between Ben Wilson in 1984 and Derrion Albert in 2009.

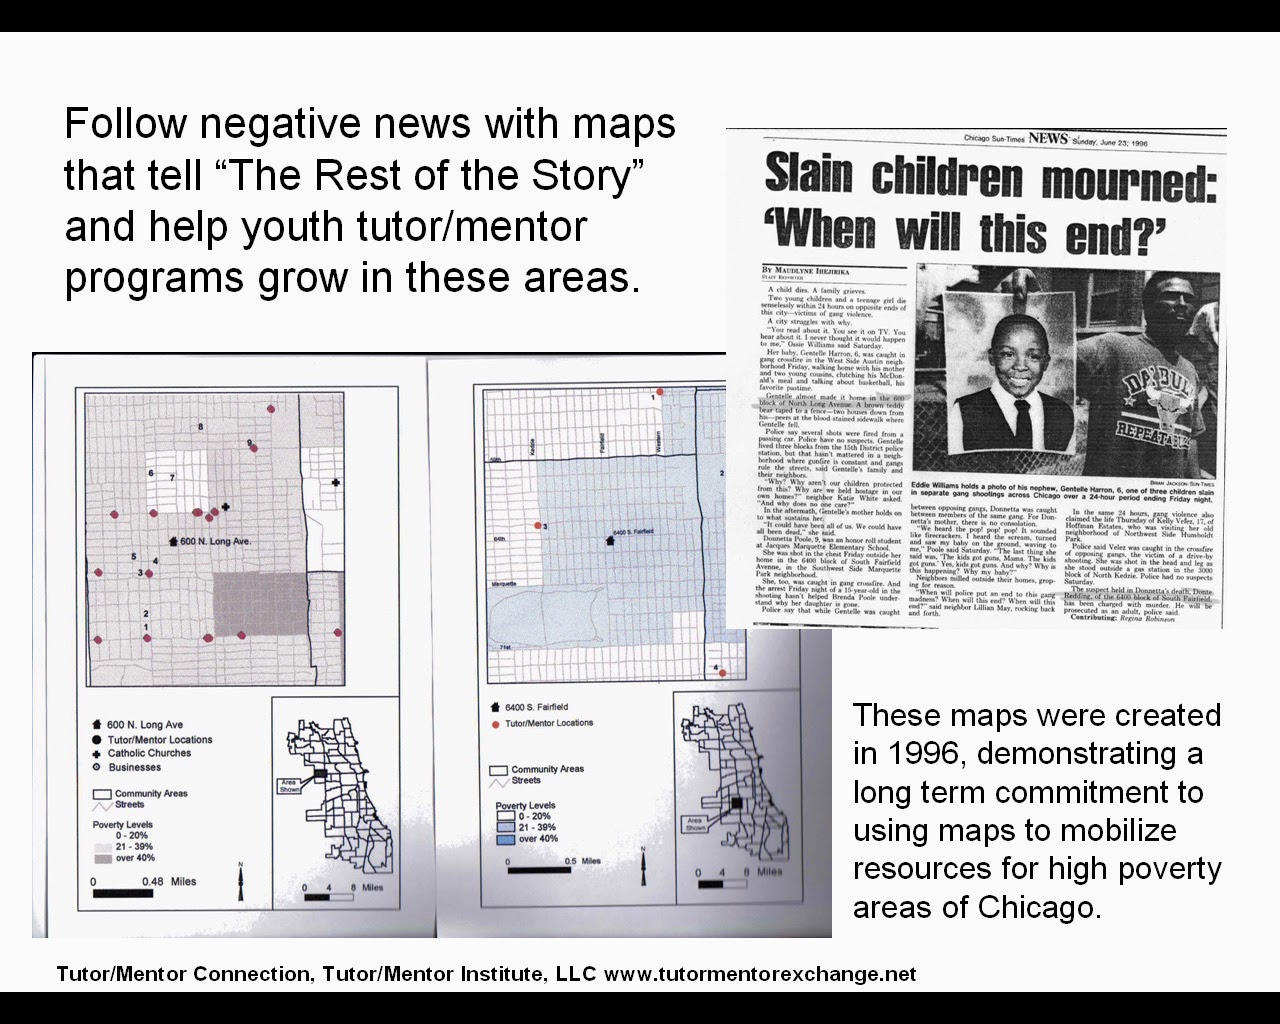
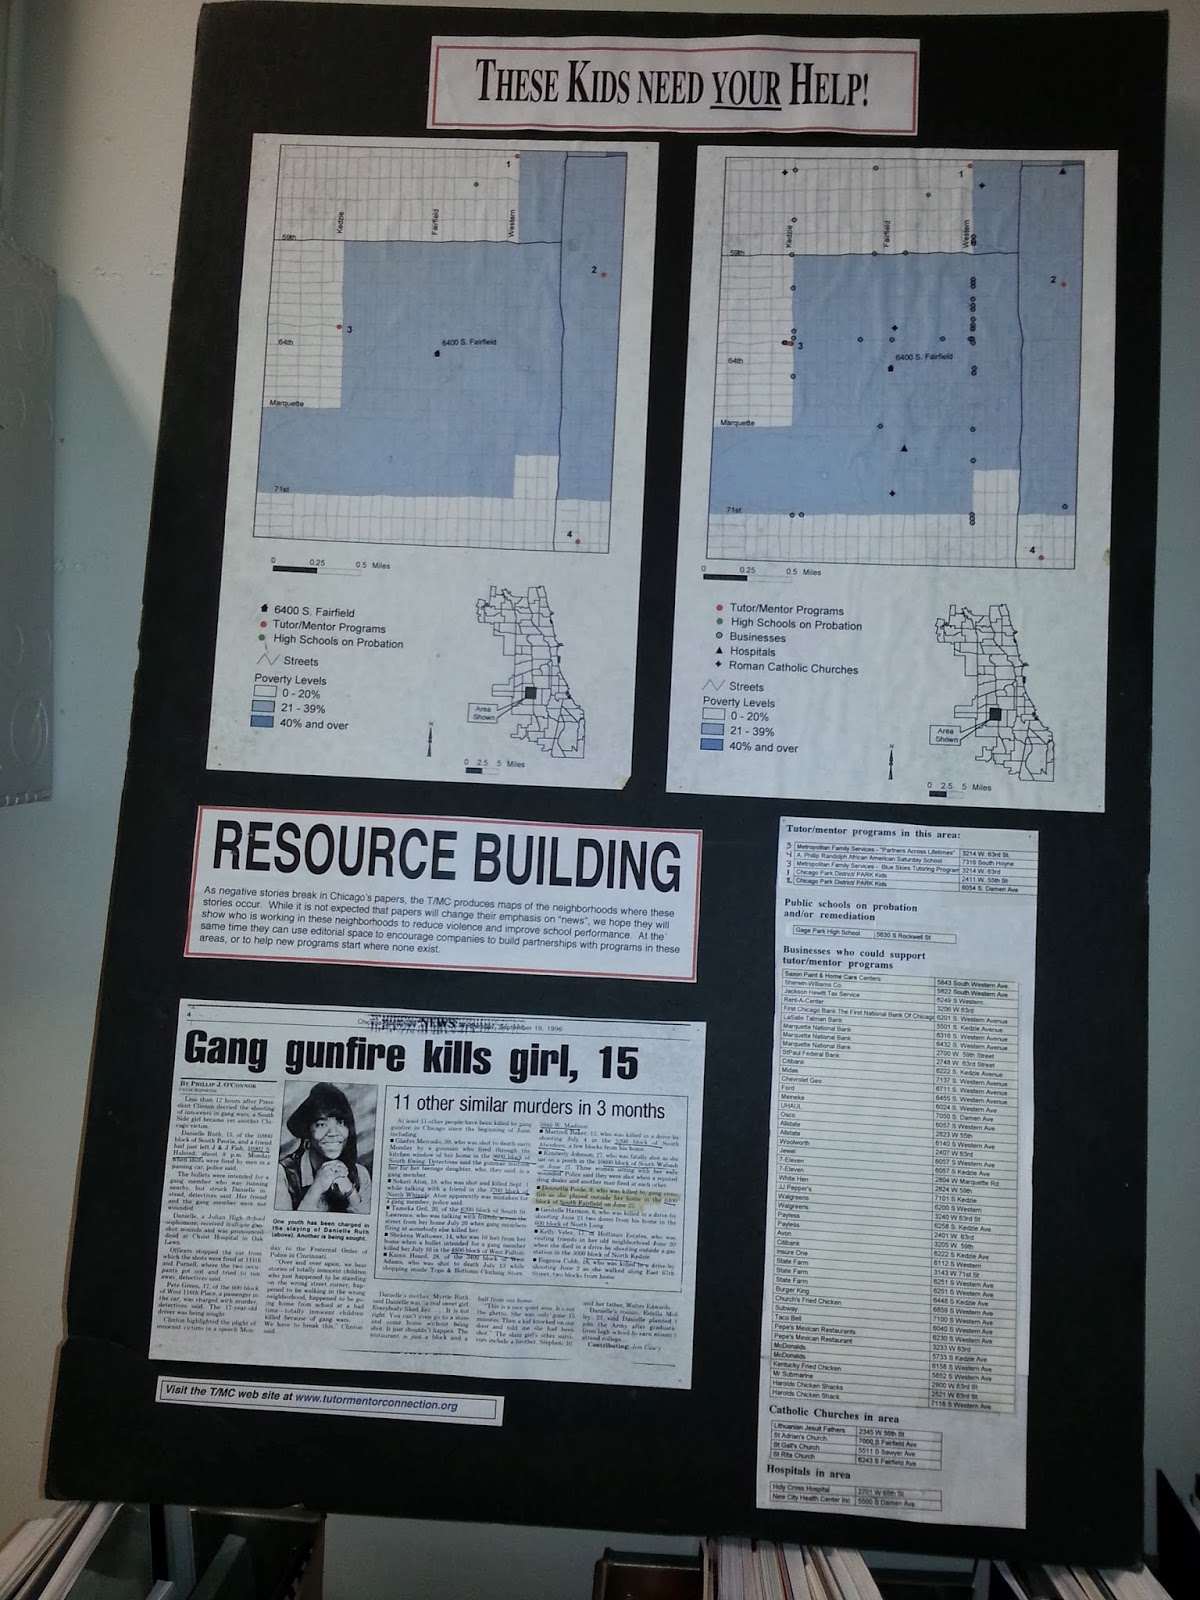
Since 1993 I've offered a strategy, that if it had been embraced and followed over the past 20 years, would have resulted in a stronger network of tutoring, mentoring, learning and career development programs in all high poverty neighborhoods of Chicago, engaging people from all parts of the region in an on-going effort to make such programs available and help them each become the best at transforming lives of youth and adult participants. This story in the 1995 Chicago Tribune is one of many that give evidence that such a plan existed.

As the Internet has become a tool I've moved my ideas and resources to web sites. Since late October 2014 I've shown concept maps that visualize the strategy and point to the information available in the library.

In 2011 I set up a conversation thread on Debategraph where we start with the topic "Helping kids in poverty move to jobs and careers". This is a platform where the conversation is broken down into sub topics, and then sub-sub topics and is intended to engage large numbers of people. In blog articles on the Tutor/Mentor Institute site I've pointed to additional tools that can support community-based problem solving.

The central tenets of the Tutor/Mentor Connection strategy are outline here and here and here.
Better information, including maps showing locations of existing programs needed to help youth move from one grade to the next, is essential. There's a cost to collecting, maintaining and constantly updating this information. However, without more people looking at the information it has little value. Since non-profits don't have advertising dollars to reach out every day to millions of people, other strategies need to do this work. I've collected news clips of hundreds of media stories. Few, if any, point readers to resource directories where they can find organizations where they can get involved with their time or talent.

More frequent "call to involvement" messages, in traditional, non tradition, business and religious media will bring more people to the type of information I and others share in on-line libraries. However, there also needs to be a process of facilitation, helping people find information they are looking for, understand existing information, and ways to become strategically involved on a personal or organizational level. Church groups have weekly discussions of scripture. The Tribune has a weekly feature highlighting "book clubs". A strategy that encourages people to learn more about poverty, violence, jobs, education, etc. and about places where they can get involved, would result more people building a growing sophistication of where and how they could give time, talent and dollars to help youth move safely through school and into jobs.

Unfortunately, I've not been able to attract consistent support from city leaders to this strategy. Not that I've not shared these ideas in a variety of formats since 1993.


I'll share this article on Twitter, Facebook and other media over the weekend. Hopefully people like Dan Profit will take a look and become an advocate and champion for this strategy. I encourage you to browse this blog and the Tutor/Mentor Institute, LLC blog, to find more stories like this that you and people in your own network can use to support your own planning and growing involvement.

Friday, November 21, 2014

Using Information as part of Problem Solving Process

Since October 25th I've been posting a series of articles that use concept maps as a tool for communicating strategy for helping kids in poverty move from birth to work, while also pointing to resources available to support leaders who adopt this commitment.

In the Tutor/Mentor Institute blog you can see more articles where I've embedded concept maps and ideas on systems thinking.

Today I'd like to introduce another map, showing the process I've been developing over the past 20 years.


On the left, I show the inputs, or information I've been aggregating since I formally created the Tutor/Mentor Connection in 1993. Across the middle I show various ways I've tried to expose this information to a growing number of people. Since I've never had advertising dollars, nor support from high profile business, political or celebrity spokespersons, the number of people I've reached has been limited, but still over a million visits to my web sites alone since 1998.

On the right, I show how formal and informal learning can help people innovate new ways to draw resources to all tutor/mentor programs in a geographic region as large as Chicago, and to help leaders of these programs use these resources, and what they can learn from each other, to constantly improve the work they do to connect youth and volunteers and help kids succeed in school, and move to jobs and careers not limited by poverty.

I've been sharing ideas like this on blogs since 2005 and email newsletters since 2001. I published printed newsletters between 1993 and 2001. Everything I've done can be done much better by others who may have more talent and resources than I have.

I've been looking for leaders in business, universities, philanthropy, etc who embrace the strategies and the way I share this information, and who want to adopt my efforts and support them with their own leadership and resources into future years.

If you're interested, here's a link to social media places where you can connect with me.

Wednesday, November 12, 2014

Tutor/Mentor Web Library Aims to Support Innovation in Youth Support World

On October 25 I started a series of articles showing Concept Maps I've created. The first was a "Strategy Map" that could be adopted by any one in business, philanthropy, politics, as a unifying image that engages the entire village of people in a city in on-going efforts intended to help youth move more successfully from "birth to work" with the help of a wide range of "extra adults" beyond family and traditional educators. Then I showed a 4-part strategy that would lead to achieving this vision, if adopted by everyone who commits to the first map.

This next map shows the information available in the Tutor/Mentor Connection web library.


The library divides into four sections. 1) Research - why and where are volunteer-based tutor/mentor programs needed? What do they look like? How do they differ?; 2) What do I need to know about the "business" of building and sustaining a non profit tutor/mentor program that needs to grow from a start up to becoming a great organization, and then needs to stay great over a decade or longer? How to raise money? How to recruit and train volunteers? How to draw attention to your organization?; 3) If I'm a parent, volunteer, donor, reporter, etc., how do I find individual non-school tutor/mentor programs in Chicago? How might I find volunteer involvements in other forms of service?; and 4) Where can I find ideas about collaboration, innovation, knowledge management, visualization and mapping that I can use to stimulate innovation and constant improvement in my organization?

While the map above shows these four information categories in detail, the map at the left shows the four sections. Click this link to go to the map. At the bottom of each node, you can click into additional maps that offer greater detail on each section, or into web sites with information related to each node.

There is a lot of information in this library, just as there's a lot of information that you will need to learn to get a degree from Harvard, Stanford, Oxford or any other university. You don't need to learn it in a day. Keep coming back to it as you build your program, or you build a corporate support strategy, and look for ideas that you can use to constantly improve the impact and scale of your effort.

I've been following MOOCs, such as the Deeper Learning MOOC, for the past couple of years. I feel the structure of these offers a form of organized learning that could attract a growing number of people who need to be involved in building and sustaining a citywide, or nationwide, network of high quality non-school tutoring, mentoring and learning programs. Such MOOCs could lead people through the various sections of my library, and of the Tutor/Mentor Institute, LLC web site, so people build their own understanding of the ideas and resources that are available, and learn to apply the information in their own efforts, and to add new information to the library based on what they are doing in their own programs, and what they learn through their own efforts.

I just need to find partners in universities, business and philanthropy to organize these, as well as manpower and talent to maintain the library, the concept maps, and share them daily with others throughout the world.

Friday, October 31, 2014

How does a city get from "here" to "there"?

There's plenty of information showing a need to provide extra learning support and mentoring for youth in high poverty areas, but few examples of sustained, decades-long, efforts by cities to build and sustain a network of programs reaching a growing number of youth in all of the high poverty areas of a city. I've used maps and graphics to illustrate the need for planning, leadership and resource development strategies that would take a city from its current level of youth serving organizations to a future level reaching more youth with higher impact organizations.

Last Saturday I posted a "strategy map" illustrating a shared commitment that needs to be adopted by leaders in every sector of business, philanthropy, government, education, non profit, etc. so more are innovating and leading actions that support the growth of strong programs.

Then on Tuesday, I posted a concept map illustrating the different supports youth in high poverty areas need to move from first grade to first job, over a 20 year period of continuous support, available in multiple neighborhoods.

So what might a city need to do to mobilize and support this level of sustained effort? Since 1994 I've been piloting a four step strategy aimed at helping tutor/mentor programs grow in all of Chicago's high poverty neighborhoods.


Step 1 includes building a library of information, including information on existing non-school youth serving organizations, and information people can use to borrow ideas from others and innovate actions that lead to constantly improving programs. These actions include new ways to generate flexible operating dollars throughout the program and intermediary network in any city.


Step 2 focuses on the marketing, social media and leadership needed to build public awareness and draw more people to the information in step 1. One of the challenges that must be overcome is the lack of advertising dollars available to create a reach and frequency of message delivery that gets more people involved, and keeps them involved.

Step 3 focuses on ways to help more people understand the information in the library, how it relates to them, and actions they can take to support the growth of one, or many, tutor/mentor programs in the city where they live, or in other parts of the country. There is so much information available that I've written many articles focused on "learning" cultures, where youth and adults are motivated to spend time on a regular basis reading and reflecting on this information.

Step 4 focuses on actions repeated throughout each year, for many years, which generate a greater flow of needed dollars, talent, technology and ideas to every one of the tutor/mentor programs operating in a city, and to every neighborhood where such programs are most needed.

This animation was created to help you understand the four part strategy and strategy map. This PDF also shows the four part strategy. This blog article does the same.

The heart of this strategy is the information collected and shared via step one. Articles I've read about innovation show that if you're exposed to ideas of how other people are already solving the same, or similar programs, you are stimulated in more ways to innovate ways to solve the same problem where you are. I've devoted an entire section of the tutor/mentor library to creativity and innovation ideas.

I've spent the past 40 years thinking of ways to influence youth and volunteers and of ways to build and sustain mentor rich non school programs that focus on the relationships between youth and adult volunteers and the long-term impact these programs can have on youth and volunteers. This, my understanding of how all of these ideas relate to each other is probably more intuitive than most other people in the country.

Yet, because I share my thinking, and my library, others can build learning organizations in high schools, colleges, business and communities and support a process that shares what I've learned with thousands of others, who then add their own ideas and talent to improve what they do to help youth in their communities move through school and into productive, adult lives and careers. Spend time looking at this information, then look for people who may already be leading this strategy in your own community. If you can't find such a group, start it yourselfe, as I did back in 1993.

As you look at this information I hope to connect with you in on-line communities as well as in conferences I host every six months in Chicago or that others are hosting at different times each year.

Tuesday, October 28, 2014

What does "mentoring to career" pipeline look like?

Last Saturday I posted an article with a strategy map, showing commitments many leaders need to take to help youth living in high poverty neighborhoods move from birth to work. Below is another map I hope you'll spend some time looking at. The link is here.


Most of us take for granted the support system we have that helps shape who we are, and how we grow up. This PDF is includes some graphics that show that the network surrounding kids living in high poverty is much different than that of most kids living beyond high poverty areas.

The concept map is intended to show supports that should be available in the lives of youth as they move from first grade to a job and career. This is a "hub and spoke" design, with the spokes leading to nodes indicating a type of support. In a couple of the nodes, such as the homework help section, you can see how I link to a web library with links to quite a few sites that learners could draw ideas from.

This graphic shows the concept map in a different way, yet it intends to communicate the same idea.

I've been seeking volunteers from engineering, design and architecture firms who would help me create an animated version of this graphic. I'm also looking for writers and data visualization people who will help fill each node on this map with links to information people can use to build and sustain age-appropriate non-school learning programs. If someone is working with a youth in 3rd grade, you should be able to click into that section of the graphic, and find information related to mentoring, tutoring and providing social/emotional support for youth at that age level. If you're working with high school kids, you should be able to click into nodes that show things you can do to support high school youth.

You should also be able to find discussion forums where people are sharing ideas, and where funders, policy makers, researchers and business leaders are also participating. Without their involvement in the process, the commitment of resources will be too narrowly focused, and to short a time frame.

The goal of these graphics is to show that youth need a wide range of support at each age level, and they need this support to continue through high school and post high school years. That means the way programs are supported needs to change, to be more consistent.

The maps on this blog intend to show that this "birth to work" support system needs to be available in every high poverty neighborhood, not just a few neighborhoods.

What is the role of volunteer mentors and tutors? They not only can draw from this information to innovate better ways to support the youth they work with. They can use this to help youth in different neighborhoods have access to more of the supports the youth need.

Visit my Tutor/Mentor blog to read more about these ideas.

Saturday, October 25, 2014

Using Concept Maps to Communicate Strategy

If you browse through articles posted on this blog since 2008 you'll see how geographic maps have been used to show where volunteer-based, non-school, learning, mentoring and tutoring programs are most needed in Chicago, based on indicators such as poverty, poor schools, violence, health disparities, etc. In the next few blog articles I'm going to post concept maps that show commitments and strategies that need to be adopted by leaders from business, government, philanthropy, entertainment, sports, and the non profit sector, if the map is to be filled with high quality programs.


I've been using CMaps, a free concept mapping tool, since 2005. This was introduced to me by Ariane Lee, a former Peace Corps volunteer, who worked for me for one year. Once she introduced CMaps to me, I began to create a variety of maps. In these maps you can follow a train of thought, from one node to another. In this strategy map, the blue box at the top can be filled by any leader who makes this commitment. As you follow the train of thought, you'll see small boxes at the bottom of each map. The box on the left leads to other web sites with related information. The box on the right, leads to additional concept maps, that provide deeper thinking related to that specific node.

In this particular map you can see a box to the left, indicating that there is an animated version of this map. It was created by interns from IIT, during six week internships in Jan-Feb and May-June, 2009. The voice over was provided by a Northwestern University graduate, who was serving a one-year fellowship. I encourage you to listen to it. The information it provides will help you navigate the map. Some of the links are broken and this needs to be updated, but the information is still useful.

This strategy can be adopted and applied to Chicago, or to any other city in the world. It can be adopted by a University or a Hospital and focus on the area around that specific university or hospital. If you'd like my help in thinking through your strategy introduce yourself to me on Twitter, LinkedIN or Facebook or email tutormentor2 at earthlink dot net.

NOTE: since posting this article in October 2014 I've posted several related articles. View them all-click here.

Friday, September 26, 2014

Chicago Health Atlas a valuable resource

This map view was created using the Chicago Health Atlas, one of the projects of the Smart Chicago Collaborative.

While a majority of the maps in the Mapping for Justice blog were created by Tutor/Mentor Connection, I've also used articles to point to other map platforms that provide indicators showing a need for extra investment and support of youth and families in neighborhoods highlighted on these maps. In this section of the Tutor/Mentor web library are more links to poverty and crime maps.

Our aim is to encourage, and inspire, a growing number of people to create videos, blog articles, books, slide presentations, etc. that use these indicators to show people beyond poverty where they need to be investing time, talent and dollars to help communities overcome challenges they cannot overcome by themselves. If youth learn to create map stories, and how to communicate these regularly as part of a call to action, they learn skills they can apply in adult lives, and provide talent that helps draw needed resources to various places shown on the map. If you're creating map stories with a goal of drawing resources to volunteer based tutor/mentor programs in different parts of Chicago, or in another city, please share your link.

Thursday, September 11, 2014

Using Data to Support Fund Raising

All of the maps on this site are intended to support actions that draw volunteers, dollars, technology and ideas to all of the high poverty areas in Chicago where a wide range of volunteer-based tutoring, mentoring and learning organizations are needed in the non-school hours.

Below is a graphic showing the home page of the Boston Indicators Project, which I've been following since around 2004.


What I've liked about this site is that it has created a list of 10 indicators/issues which represent most of the major issues of concern to people in the Boston area. If you click into any of the issue areas you can dig deeper into a wide range of data, maps, articles, etc. to help you better understand the problem and potential solutions.

On the right bottom of the home page is a section focused on the Boston Giving Common, created by the Boston Foundation.

I created screen shots showing the progression of pages you find as you click into the Giving Common. First, you'll find ten categories, which align with the 10 issue areas on the Boston Indicators site. If you click any of these, such as youth development, you go to a page listing youth development organizations in the Boston area. If you click on an organization you go to a page with financial information, web site address, and a button that you can click to make a donation!

I don't know if this represents all youth serving organizations in Boston, or just a few.
I also don't see maps that show locations of different organizations, with layers showing different types of services, or different age groups served, which is what I've created on the Chicago Tutor/Mentor Program Locator.

I also don't see an explanation of a year-round strategy intended to draw a growing number of volunteers and donors to this web site so more will become supporters of different programs. I also don't see a use of MOOCs or engagement of youth as story-tellers, as part of a strategy to engage growing numbers of people to focus on each separate issue area.

Yet this is a great model of a high profile community organization acting to leverage it's own giving by encouraging others to support organizations in the region who require consistent, on-going and flexible operating dollars and a wide range of talent to have a growing impact on solving the problems that the indicators show face Boston. It has constantly been improving what it does since I first saw the site many years ago. I suspect it's leaders will be adding some of the features I've mentioned as the look for more ways to engage Boston area citizens, social benefit organizations and resource providers.

While I write about this, I also share my interest using my Twitter @tutormentorteam feed. And I've added the link to this section of my web library so others can find this and use it to inspire their own efforts. I've shared this with Chicago organizations and hope I'm invited into brainstorming conversations and planning groups who are looking for ways to mobilize all stakeholders in the region in long-term problem solving.

If you're aware of something like this in other cities, or something working even better to draw needed resources to all of the neighborhoods who need a wide range of services, share the link on your own blog and with me via a comment or a Tweet.

Monday, September 1, 2014

US Schools Highly Segregated


This Metro Trends Blog article shows that "Despite our country’s growing diversity, our public schools provide little contact between white students and students of color. Metro Trends has mapped data about the racial composition of US public schools to shed light on today’s patterns at the county level. These maps show that America’s public schools are highly segregated by race and income, with the declining share of white students typically concentrated in schools with other white students and the growing share of Latino students concentrated into low-income public schools with other students of color." Read the article.

Wednesday, August 13, 2014

Changes in race and poverty in US since 1980

This interactive map can be used to help build and understanding of where poverty is concentrated in the US and how this has changed since 1980.

Browse the articles on this site to see how map stories can be created using map platforms like this. Such stories can be used to build public awareness and mobilize leaders and resources to fill high poverty areas with a wide range of youth and family supports.

Browse sections of the Tutor/Mentor Institute blog and you'll see more examples of maps and graphics. Use these as examples that can be duplicated by volunteers, leaders, media in Chicago and other cities.

Monday, July 14, 2014

Forbes map shows where wealthiest US families are located

I use maps to show where organized volunteer-based tutor/mentor programs are located, and where they are most needed, based on indicators like high poverty, violence, health disparities, etc. My efforts intend to catch the attention of donors who have the ability to provide on-going operating dollars to support high quality programs in all neighborhoods.

Today I was encouraged to take a look at an interactive map on the Forbes.com web site showing locations of 180 billionaire families. See the map here.

Imagine how much more we could do to help young people in high poverty areas is just one of these familes in each part of the country adopted the Tutor/Mentor Connection strategy and commitment, shown on this animation, and this concept map.

Monday, May 26, 2014

Create Map Stories following Negative News

Throughout this blog and the Tutor/Mentor Blog I show how maps can be created to focus attention and resources on places in Chicago where bad things are happening to good people.

Maps can be created using the Tutor/Mentor Program Locator, or by using other map resources, such as this homicide map hosted by the Chicago SunTimes.

If you browse this blog you'll see other mapping platforms that can be used to create images for blogs and social media articles. These are tools that youth and adult volunteers could use in creating map stories that leverage the attention created by traditional media coverage of negative news. Such stories, if repeated over and over, could begin to motivate adults in different parts of the Chicago region (or in other cities) to provide the on-going flow of resources that are needed to create mentor-rich programs and learning opportunities for K-12 youth in neighborhoods where lack of opportunity contributes to lack of hope, which contributes to many of the negatives that are reported too often in the media.

See this album for map stories from the 1990s and this Map Gallery for stories from between 2008 and 2011.

If you're already creating map stories for the purpose of drawing resources to neighborhoods, point to this list of Chicago tutoring and/or mentoring programs as you call on leaders to provide resources so your stories are helping existing programs grow.

Share your stories with me on Twitter @tutormentorteam or on Facebook in this group.

Friday, May 2, 2014

How is the Chicago Tutor/Mentor Program Locator Supposed to Work?

If you've visited the Chicago Tutor/Mentor Program Locator recently you'll see that some features, such as the boundary overlays, the zip code overlay, and the political district overlays, do not work. We're also having trouble adding new program information. This is all a result of Google changing how sites like mine interface with their map, and the fact that I don't have any money, or tech talent, to fix the problem.

If you want to know how this should work, visit the Chicago Public Schools "School Locator" page. It may take you a while to figure out how this works, but on the left side is a label that says "political overlays". Click on any of these and you'll see political district outlines on the map.

Now on the Tutor/Mentor Program locator, you'd be able to use a drop down menu to zoom into a specific district or geographic areas. I don't see this on the CPS locator, but I really like the way the technology works.

Of course, having a great map-directory is only useful if many people are using the maps to tell stories that draw needed resources into school neighborhoods so families and schools have more help encouraging youth to become active learners who take a greater responsibility for their own learning, and their own futures.

If you are creating map stories using this information please post a link to this article so others can learn from how you are using the maps.

Wednesday, April 2, 2014

Using Multiple Data Sources

In the articles on this blog I've shown maps I've created using a desk top GIS mapping system, as well as the interactive Chicago Tutor/Mentor Program Locator. However, this is just one of many resources that need to be used to build a better understanding of the comprehensive problems caused by where you live or where you were born. I feel there needs to be a generation of activists who create map stories, drawing upon all of these resources.

As I find new map portals I add them to the web library that I've been building since 1998. Then I write a blog article here, or on the Tutor/Mentor Blog, to draw attention to the resource.

The map at the left is from the 2014 Annie E. Casey Foundation report titled "Race for Results: Building a Path to Opportunity for All Children" Visit the web site and view the report, as well as a recording of a panel discussion held to announce the release of the report and discuss its findings.

This second map is from a Civil Rights Project report titled "New York State’s Extreme School Segregation: Inequality, Inaction and a Damaged Future"

This third image is from the County Health Rankings and Roadmaps web site, showing health disparities in Illinois counties.

Browse this blog and you'll find links to many other map resources. Visit this section of the web library for more examples of mapping and visualization.


Each of these web sites is a tremendous resource, but they only tell part of a story. If we're to build public will to solve the problems indicated in these reports, in all of the places shown on the map, we need a massive increase in the number of people telling map stories on a daily basis, connecting maps and data from many sources into stories that motivate more people to give time, talent, dollars and votes to solve the problems these reports show to be embedded in many parts of the country.

Monday, March 17, 2014

A little luck could go a long way

In 1997 I had to strokes of good luck. HSBC Worldwide selected my organization to share in its year-end holiday gift, which amounted to nearly $60,000. At the same time, an anonymous donor gave $50,000 to rebuild the GIS mapping capacity of the Tutor/Mentor Connection. As a result, this blog and all of the map stories created since 2008 were made available and the interactive Chicago tutor/mentor program locator was created.

Unfortunately that good luck was followed by seven years of bad luck, starting with the financial melt down that resulted in loosing HSBC support for our technology strategies, and ultimately, looking the funding to keep paying for a map maker and continued upgrades to the program locator technology, and then the 2011 decision of the Cabrini Connections Board to discontinue its support of the Tutor/Mentor Connection strategy.

Despite all of this I've continued to publish map stories, build the network of support for tutor/mentor programs in Chicago and other cities, maintain a web library that records more than 9,000 visitors a month, and host a spring and fall Tutor/Mentor Leadership & Networking Conference in Chicago.

It's about time for some good fortune to come this way and maybe today will be the beginning.

Yet, while I seek financial and talent support for my own efforts, I know nearly 70% of the other tutoring and/or mentoring programs in Illinois are also seeking the same support. Thus, I keep pointing to the program locator, and this list of Chicago youth organizations, hoping they all have the luck of the Irish and receive the financial and talent support they need.

Monday, March 10, 2014

Create your own story maps - a tutorial

I started using maps to tell stories in 1993. Back then the technology to create a map story was beyond reach of most people and the distribution channel needed to get your map story in front of a desired audience was also closed to most people.

Much has changed since then. Here's an article on the GIS and Science blog showing how anyone can create their own map stories.

Here's a tutorial showing how to use the Chicago Tutor/Mentor Program Locator to create maps focused on helping volunteer-based tutor/mentor programs grow in high poverty areas.

As you create your maps and share them on blogs, Instagram, Pinterest, etc. share them with us via Twitter or by posting a comment on this blog.

Saturday, February 15, 2014

Creating Map Stories Following Negative News

This album shows some of the map stories created by Tutor/Mentor Connection since 1993 as part of a strategy intended to increase attention on volunteer-based tutoring/mentoring as a strategy for engaging more adults in a wide range of long-term efforts to help kids stay safe in non-school hours, expand their social capital, and keep moving through school toward jobs and careers.


Find more photos like this on Tutor/Mentor Connection
In this blog, the Tutor/Mentor Blog and the Tutor/Mentor Institute,LLC site you'll see numerous examples of maps included in stories.

In this article we describe how youth from many different schools, non school programs, colleges and faith groups could create their own map-stories, focusing on their own school neighborhood or community.

If you are already applying these ideas please share your web address so we can point to you and learn from you. If you'd like our help in developing this strategy, introduce yourself.

Thursday, February 6, 2014

Map Directory update by Intern

In 2008-2009 I was able to build an interactive Chicago Tutor/Mentor Program Locator Map/Directory that could be used by leaders in Chicago to help build and sustain mentor-rich, non-school tutor/mentor programs in high poverty neighborhoods. This image was created by combining layers of information showing poverty, poorly performing schools, existing programs and community assets, like banks then zooming in to show a specific part of Chicago.

We ran out of money in 2009 and have not been able to update the technology, or the content, in the years since then, except for keeping the information about tutor/mentor programs (the green stars) current.

One section of the Program Locator focuses on Assets, such as banks, insurance companies, faith groups, colleges, hospitals, etc. who could be strategically involved in supporting the on-going operations of tutor/mentor programs in sections of the city where they have facilities.

When we built the Program Locator in 2008-9 we included locations of eight banks. Since then some have expanded, and some have gone out of business, such as Park National Bank. Since I was not able to update the program locator myself, we've had to live with this outdated information.

I've had interns from Illinois Institute of Technology working with me for six week periods in Jan-Feb and May-June since 2006. On this page you can see work they've done to communicate strategies via various visualizations.


One of our Jan-Feb 2014 interns volunteered to look at the Program Locator, and after three weeks he has updated the Banks section, adding six additional banks and replacing Park National with one more.

Now when you look at the Banks section of the asset maps you'll see a much richer range of banks. I hope that neighborhood groups and volunteer teams from the banks will use this information to bring together networks of business, non profit, educator, faith groups and other community assets and leaders to develop an understanding of the current level of tutor/mentor programs available in different neighborhoods, and to build on-going strategies to help existing and new programs constantly learn from each other and from effective practices around the world, so each program in every neighborhood of the Chicago region can be considered "world class" in helping kids through school and into 21st century jobs and careers.

The purpose of the Interactive Program Locator is that when bad things happen in a city neighborhood, and get feature and editorial attention in the major newspapers, a map can be created showing where the incident happened, and showing businesses, hospitals, faith groups, etc. in the neighborhood who should be working together to make mentor-rich non-school tutoring, mentoring and learning programs more available in the neighborhood where the incident occurred, and in other neighborhoods with similar history. Until the interactive Program Locator was created in 2008-09 we were making map stories and displaying them like you see in this graphic.

If you're doing this work join us at the next Tutor/Mentor Conference to share what you're doing. If you're a business or volunteer who wants to support the Tutor/Mentor Institute, LLC's mapping strategies, introduce yourself on Twitter, Facebook and/or Linked in. Email tutormentor2@earthlink.net to offer your time, talent AND/or financial support to booster this effort.

Thursday, January 23, 2014

Using Maps and Media To Draw Resources to Neighborhoods

Today I posted a story on the Tutor/Mentor Blog showing how I've been creating map stories like this one since 1993, in an effort to build greater attention for tutor/mentor programs in neighborhoods where incidents of violence are highlighted in the media.

I've been doing map stories with the help of volunteers, and occasionally with paid staff, since launching the Tutor/Mentor Connection. Since I don't have advertising dollars, my strategy has been to follow news stories where violence, gangs and/or poorly performing schools have been giving front page, or major emphasis on inside pages of the Chicago Tribune or the Chicago SunTimes, which are the two major papers in Chicago, each reaching several hundred thousand readers a day.

If the media story builds public interest and a desire for readers to get involved, map-stories like these can tell "The Rest of The Story", which is what the media do not do consistently include in their stories. We can show indicators of why shootings are taking place, or why students perform poorly in public schools, and we can show if there are any non-school, volunteer-based tutoring and/or mentoring programs in the area around where the story took place. We can also show some of the businesses, faith groups, hospitals and/or universities that share the same geography, and who should be strategically involved in making high quality, constantly improving tutor/mentor programs available in these areas.

Youth in middle and high schools throughout the Chicago region, and in other cities could be creating these stories, and could be involved in collecting and maintaining information about non-school programs in different neighborhoods. This article and this article offer suggestions for getting young people involved.

See additional map stories here and in the Tutor/Mentor Map Gallery.

If you're implementing this strategy, share a link to your own blog articles and connect with us on Twitter or Facebook.