Showing posts with label library. Show all posts

Thursday, August 28, 2025

Explore the maps. Create your own stories.

I've been using maps since 1994 to show where Chicago area kids need extra help based on the level of poverty and inequality in the areas where they live. This blog was created in 2008 to show maps my organization was creating. Since 2011 the blog has shared maps created using our interactive map-based Chicago Tutor/Mentor Program Locator. 

The Program Locator has only been available as an archive since around 2017, so the blog has been used to show data platforms hosted by others.  Below is a concept map showing some of the platforms found in this section of the Tutor/Mentor library.


On this concept map I've circled one node, titled "Education data".  Click on the small box at the bottom of the node and you see three links.  I opened the one titled "Education Opportunity Map".

This is the "Education Opportunity Project at Stanford University".  This page shows three projects. I chose the "Segregation Tracking Project" and opened the map shown below.


In the lower right is a legend. The green shading shows the level of White-Black Segregation between schools in each state, with the dark green being the most segregated.   The orange shading shows the percent of White Students in individual schools, with the darker Orange being the highest.

I zoomed in to the Chicago region, to the map-view shown below.  This map shows the level of segregation in individual schools.  Just click on any of the dots and a pop-up will show the name of the school and level of segregation.


I zoomed in as far as the site would allow.  The map below shows the South Side of Chicago.


The dark green background shows that this is a highly segregated area and the white dots showing individual schools, confirms that.

I've written about segregation several times in past years.  Open this link to find articles on this site, and open this link to find articles on the Tutor/Mentor blog. 

Now create your own map stories. 

Explore the data platforms shown on the concept map at the top of this article. Zoom into your own city, state and/or neighborhood.  Learn about needs and opportunities. 

Then brows my blog and use my articles as templates, to see how you might embed maps in articles and/or videos intended to draw more people to information about race, segregation and inequality, and to draw more people to organizations working with youth and families living in areas of persistent poverty.


Students in middle school, high school and college can learn to do this. At some point in the future every city should have at least one blog like this one, sharing datamaps and stories created by others, and drawing attention to places where people need extra help.

I've created many visual essays that show how maps and map-stories, created by many people, can have a huge impact on changing public policy and influencing the flow of needed resources into high poverty, highly segregated neighborhoods.  Here' one example. 

Find more like that in this collection. 

Thanks for reading. I hope you'll share this, and your own work.  Connect with me on LinkedIn, Twitter, Facebook, Instagram, BlueSky and Mastodon (see links here). 

I depend on help from a small group of donors to fund the work I'm doing.  Please visit this page and add your own support. 

Wednesday, July 9, 2025

Learning, network building and innovation

Since March 2025 I've not added new links to the Tutor/Mentor library since the site was being upgraded. That work finished last week so I've added many links that I'd seen in the past few months. 

Below is a view of the VizDex website, which is a library of personal and independent blogs and newsletters dedicated to data visualization.   

I saw mention of this on one of my social media feeds and once I visited the site I asked if my MappingforJustice blog would qualify.  The answer was "yes" as you can see from the image I've posted.

I've now added that link to my own library.  For the past few years, as I've added new links, I notified viewers by putting that link on my "new additions" page.  Below you can see the "new links for 2025" page.


When you look at this list, note that under every listing is a "find in this section" statement, with a link to the section of the library where I added the link.

In this case, it points to a page where I've several dozen links to websites that demonstrate uses of concept maps and visualization. 


These are in alphabetical order so you need to scroll to the bottom of the list to find the VizDex site. As you do you'll find many more sites where you can learn ways to use concept maps and visualizations.

One of those you'll see is this Power Mapping article on a website named "The Commons: Social Change Library". 


This article is particularly relevant because it describes my own vision of using concept maps to "know the network, then nudge the network".  And it's part of a much larger library of social change information managed by The Commons. 

Below is a page from a visual essay where I describe how the links I point to are experts in specific topics and often host libraries of their own.  Thus, I don't need to have "everything" in my own library if I can point to others who have greater depth of specific topics than I have.


I've posted several articles on the Tutor/Mentor library showing how my library was intended to stimulate innovation and constant improvement within the youth/workforce development ecosystem. In this article I included this statement.

I started building a library of research and peer tutor/mentor program information in the 1970s, to stimulate the thinking and innovation of volunteers working with me to build the tutor/mentor program I was leading at the Montgomery Ward Corporation in Chicago. As I created my library, began sharing it with peers, leading other programs. I formalized this information collection/sharing in 1993 when I created the Tutor/Mentor Connection. Now I host an extensive web library of information, with links to more than 2000 other web sites, that anyone in Chicago, or the world, can dig into to find "carrots" that inspire their own innovation and constant improvement.

I was pleased that the VizDex leaders added this blog to their list. I wish more were doing the same and that we were working collectively toward motivating more people to use the libraries for on-going learning and problem solving.  Furthermore, I'd love to find people using the Power Mapping ideas who are building maps showing the ecosystem needed to change policy and make more, and better, long-term youth development, learning and career development resources available in every area with concentrations of persistent poverty.  

We need to be connected and working collectively to draw attention to the resources we are sharing.

Thanks for reading.  I hope you'll connect with me on LinkedIn, BlueSky, Facebook, Twitter, Mastodon and other platforms and share links to your own libraries and blogs.  

I also ask that you consider making a contribution to help me fund the Tutor/Mentor Institute, LLC so I can continue to keep the library on-line and freely available to the world.  Click here to learn more. 

Wednesday, October 30, 2024

After the election the work continues

11-6-2024 update - the election was not the result I and millions of others wanted. Yet, what I wrote last week is still true.

The US election next week will be a tipping point. Which way do we go as a democracy?  I voted for Kamala Harris and hope she wins.  But I realize that is just a step in the work we need to be doing to solve the complex problems facing the US and the world.

I've used this blog since 2008 to share uses of GIS maps to show where people need extra help, and to show where help is being delivered.  In one set of links in the Tutor/Mentor library I point to many websites showing uses of GIS maps.

I've posted several articles over the past 20 years showing why I've built a library and how I hope people will use it.  

Below is what I wrote on the Tutor/Mentor blog in November 2022.

Below is a post I saw on Twitter, showing a "Social Change Ecosystem Framework" developed by Deepa Iyer, of the SolidarityIs and Building Movement Project.  

Here's an article by Deepa Iyer that describes a use of this Social Change Map.  I love the "hub and spoke" design she uses and how this shows the range of people and networks who need to be part of any problem-solving ecosystem.  

I've used similar visualizations for more than 20 years.

You can see these in hundreds of articles on this blog.  I've posted several dozen articles since 2005 that I've tagged "complex problems".  And many more tagged "network building".  Plus a few more tagged "ecosystem". 

Below is a concept map created more than 10 years ago that shows the range of talents and networks that need to be involved in solving any complex problem.

All of these emphasize that no single person can solve the many complex problems we face locally and globally.  If you scroll through the articles tagged complex problems you'll find many visualizations showing complexity. 

I found another on my LinkedIn feed this week.

This graphic by Christian Sarkar can be viewed in an article titled "The Ecosystem of Wicked Problems".  

One of the features of this graphic is that it shows relationships and how the problems are inter-related to each other.  

What would have made it better (in my opinion) would have been links from each node, to web libraries with information about each problem.

For instance, here's my concept map showing the research section of the Tutor/Mentor Library.  At the bottom of each node is a link to a specific collection of websites.

Linking to libraries like this would expand the information anyone has to understand a problem, to connect with others who are also trying to solve the problem, and to find work being done in some places to solve the problem that might stimulate innovation and/or duplication in many other places.

The challenge, of course, is building and maintaining such libraries, and attracting people to use the information.  And, finding consistent funding to pay for the work.  I was never able to do that. 

I hypothesize that every link I point to from my library represents an ecosystem of many people working for that organization and an even greater number who that organization and its employees connect with.  

Looking at the graphics by Christian Sarkar and Deepa Iyer, imagine people from each of these nodes connecting with each other in on-going learning, innovation, resource development and problem solving.

Who are all of those people? Who are all of the organizations working in each category? 

Someone who's been doing some deep thinking about part of this is Greg Bloom, Founder of Open Referral. He was the speaker at the November 15, 2022 ChiHackNight event.  

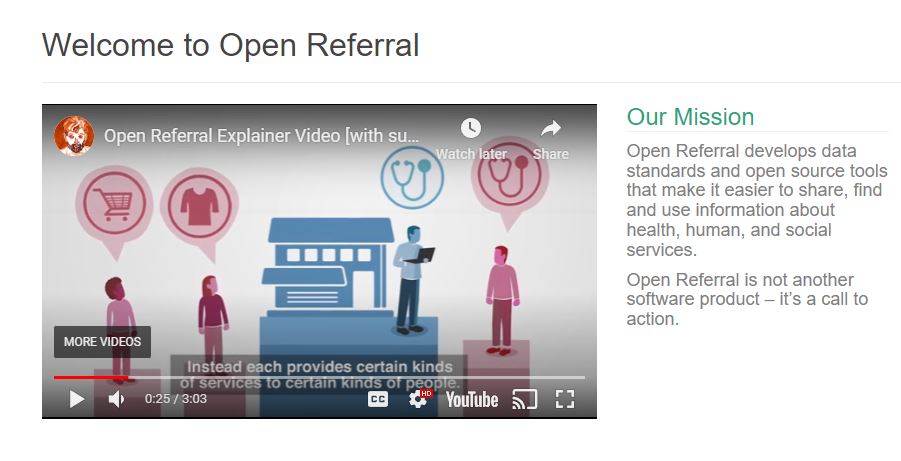
I encourage you to view the short video on the home page of the Open Referral website to understand the important work they are doing and the problems they are addressing. 


Greg's group has been bringing people together since 2012 to talk about the challenges of building and maintaining information directories and to "create a common set of data standards, that define and structure information, so that it can be readily transferred between systems".  Read through the FAQ questions and answers on the Open Referral website to understand this better. 

View Greg's Nov 15 presentation to ChiHackNight.  click here

That means many distributed directories could be connected in larger directories, making more information available to more people.

The Tutor/Mentor Connection, which I and a few others created in 1993 and launched in 1994, has been collecting information about Chicago area volunteer-based tutor/mentor programs for 30 years, along with building a library that represents the ecosystem of research, resources, funding, businesses and everyone else who needs to be involved in helping kids in poverty move more safely from birth-to-work.

We published our first printed directory of Chicago tutor and mentor programs, and the ecosystem of those who support them, in 1994 and updated it annually through 2003. After that all of our information was put on-line. 

We had others ask us to share the data, but who never offered to help pay the costs of collecting and maintaining it.  I never did this for fear of the larger organization eliminating the need for our work, and then at some point in the future, ceasing operation, so none of the data we had been collecting would remain available. 

Furthermore, if our data was owned by a national organization, the people who managed it would not have local passion, or local purpose, to use the data regularly to help existing programs constantly improve, nor to help new programs form where data analysis showed more were needed. 

That was why we were collecting the information in the first place!

Thus, I proposed there be a decentralized collection of data that was shared in a system similar to what Greg has been working on. Back in the 1990s the technology, or motivation, to do this was not available.

Thus, I fully understand the challenges Greg describes. For the past 10 years I've been a one-person army trying to maintain the library, share it, and get people to talk to myself, and each other.  If you read though this blog you can find hundreds of articles that relate to this.

Bringing people together.

When we were planning the Tutor/Mentor Connection in 1993 and talking about building a directory our PR partner from Public Communications, Inc. in Chicago, said "You've got to host a conference!".  

Using the contact information from organizations we learned about through our survey and our networking, we hosted a first Tutor/Mentor Leadership and Networking Conference in May 1994 and hosted one every six months after that until May 2015, at which time I had to stop due to lack of money.

In this article you can see a map showing participation over 20 years.  Here's a presentation showing how universities hosted these conferences and how I reached out to them for many years.  Between 1996 and 2002 attendance ranged from over 150 to over 300. Our mailing list grew from 400 to 14,000. This represented quite a large ecosystem, yet, it was not attracting business, philanthropy, government or university participants.   Thus, there were always too few of "the right people" to fully build the Tutor/Mentor Connection to what I hoped it would accomplish.

Since forming the Tutor/Mentor Institute, LLC in 2011 the range of people I've been reaching dramatically declined and conference participation dropped to around 100 per event. 

So let me sum up.

1) the world is dealing with complex problems and some people are creating great visualizations showing this complexity;

2) some people recognize the difficulty of collecting and sharing social service information and are trying to innovate new solutions;

3) knowing "who" should be included in a directory, or in an "invitation list" is part of the problem in a big city like Chicago;  getting them to come to "your event" or into "your conversation" is a huge challenge if you're not well-connected, or have a reputation that draws people to you.  Getting into "their conversations" and "being heard" is just as difficult.

4) I find very few people creating visualizations of who should be connected, or who they are bringing together via their events.

5) even if you have a list of "who" unless you do some sort of network analysis of event participation and/or social media conversations, you don't really know how well your network is connecting.

I'm sure readers might list more problems. I'd love to hear from you.

This has already been a long article, but if you've made it this far I encourage you to go one article further.  Review the 4-part strategy described in this concept map.

The "information collection" described in this article is just STEP 1. Getting people to look at the information (step 2) and helping them understand it (step 3) and use it (step 4) also need to be funded and supported as part of any problem-solving process.

---- end 2022 article ----

Last week I posted another "after the election" article on the Tutor/Mentor blog. Click here to read it.  Having libraries like mine can help people innovate solutions to problems based on how others may already be trying to solve them, and can help find others to help with the work.  

Electing Kamala Harris and Tim Walz blunts the regressive policies being promoted by the ultra conservatives but does not fix the problems that we face. Those who are funding Trump will still be trying to change the face of America in 2025 and beyond.  

It will take an ecosystem of people to build and sustain an America that creates hope and opportunity for everyone and dims the passions of the fanatics. I hope the next administration helps such systems grow and that my resources will be useful. 

Thanks for reading. I hope you'll share this.  I'll be 78 on December 19th and I keep looking for people/institutions who will take ownership of my archives, the library and this vision of supporting problem solving with extensive libraries like mine.

I'm on Twitter, LinkedIn, BlueSky, Instagram, Facebook and Mastodon. (see links here).  Let's connect.

If you appreciate these articles please visit my FundT/MI page and send a small contribution. 


Saturday, August 10, 2024

Governor Tim Walz - a 'GIS Nerd' - ESRI Blog

There are many reasons to like the selection of Governor Tim Walz of Minnesota as the Vice President candidate of the Democratic Party.  One that's close to my heart is shown in this ESRI 2024 blog article, titled "Why Governor Tim Walz is a 'GIS Nerd' and What that Means for the US".


I encourage you to read the ESRI article, then go to the Minnesota Executive Map Portfolio and view each collection.  Open the collection under "Minnesota Children, Youth and Families" and you'll see the page I show below.


Click on any of the maps and it opens to an interactive map where you can enlarge and look closely at any part of the state.  The example I show below is from the "Children in Poverty" map. I've zoomed into the Minneapolis - St. Paul area.


The more you enlarge the map, or zoom into a specific area, the greater the level of detail you'll see.  Notice that if you click on the map a pop up will show the number of children under age 18 that live below the poverty line and what percent of children this represents for that census tract.

I've added a link to the ESRI article and the Minnesota Executive Map Portfolio in this section of the Tutor/Mentor library.  

In my April 2024 article I shared this page from a 1997 Tutor/Mentor newsletter and asked "What if Leaders had used maps like this?" 

Maybe they are.  I can't tell from the maps I'm viewing on the Minnesota site.   The maps are great, as far as they go.  

What I don't see (maybe it is someplace else) is a set of maps answering the questions of "How many tutor/mentor programs are needed?"  and "What programs already exist?", sorted by type of program, age group served and location".  

Nor do I see a section of blogs where writers have created images like I show above, and embedded them in articles, like I'm doing here.  As a teacher, maybe Governor Walz was teaching youth to create map stories.  Does anyone have a link to a collection of blogs that show this? 

Browse past articles on this blog, and the Tutor/Mentor blog and you can see how I've been trying to use maps.  If you're familiar with the Minnesota maps, of similar collections from other states, do you see information showing maps being used for the same purposes that I've been trying to use them?  

Below is an example.   This is a page from a PDF essay that I first created in 2011, then updated in 2018.


It shows community areas of Chicago, and the number of high poverty youth, age 6-17, in that area. It also shows what percent this represents.  The green stars on the map are known volunteer-based tutor/mentor programs in this area.  The platform I used to create this was the Chicago Tutor/Mentor Program Locator, launched in 2004 and updated in 2008, which was also interactive.  


As you can see from this image, you could sort my maps for programs in specific zip codes, and that provide different forms of volunteer-based tutoring and/or mentoring services to different age groups.

If you look at the Minnesota map above, it shows this information in a much better format.  It just does not include information about service providers.  Thus, it cannot be used by the Governor or any other group to draw attention, volunteers and donors to the providers, or to determine where more programs are needed.

I wish I'd connected with Governor Walz in the late 2000s when I first launched the Program Locator and in the 2015-17 period when i ran out of money to keep it active.  Now it's an archive, which you can read about on this page. 

This is the type of image I'd like to find on the website of political and business leaders in every state.  It's me, in the mid 1990s, with a Chicago Tribune article on the screen behind me saying "City Kids at Risk". 

Kids in every city and state have been at risk for more than 30 years but I've not found any leader who has the same history as I have, trying to create an information base people could use, then trying to build on-going visibility so more people use the information to help programs grow that help kids in high poverty areas move through school and into jobs and adult lives free of poverty.

It sounds like Governor Tim Walz may have been doing much of this.  Too bad we've never met.

Until now.  I know he's busy with the election, but if you know him, share this article and my blogs. Hopefully we'll connect after he's elected Vice President of the United States and  he can champion this strategy in every city and state. 

Connect with me on Twitter, Instagram, Facebook, LinkedIn, Mastodon and other platforms. See links here. 

Please send a contribution to help me keep sharing these stories. Visit this page. 


Monday, July 1, 2019

Collective Mapping - Resources

I've followed the From Poverty to Power blog for a few years because of the informative articles. The image below is from an article on Collective Mapping, posted today.

#PowerShifts Resources: Collective Mapping - click here

If you browse through past articles on this blog you'll find many examples of how I've attempted to use maps to show where volunteer based tutor and mentoring programs are most needed, where existing programs are located, and ways people can help those programs grow.

I've depended on volunteers and inconsistent donations to create the maps and map platform you see on this site.  My goal for the past few years and going forward is to find people who will use my history as a template for building new versions of my mapping and apply them in cities across the world.

At the same time, I've been creating a web library showing ways people are using #maps and showing platforms and technology that can be used. This cMap is one way I share that information.

Open this cMap and visit the mapping platforms that I point to.
I use maps in articles on this blog, and the Tutor/Mentor blog, to draw attention to areas with high poverty, or high violence, where long-term youth tutor/mentor programs are most needed. If you read these, please share.  However, another way to read these is to use them as templates for your own articles, focusing on  your own cities, if you're not from Chicago.

To  have an impact, thousands of people need to be telling stories using maps, not just myself or a few people. 

You can connect with me on one of these social media sites. 

If you want to make a small contribution to support my work, click here.


Tuesday, October 9, 2018

World Wide Inequality Index - Interactive Map

Inequality Index
I created the Tutor/Mentor Connection in 1993 with the goal of collecting and sharing information showing work being done in some parts of the world that could be borrowed and duplicate in other places.  Instead of constant reinvention, we need constant learning and innovation.

With that in mind, here's a web site/data map showing a World Wide Inequality Index, which is an annual "global ranking of governments based on what they are doing to tackle the gap between rich and poor".

Reclaim American Dream
Here's another example. This is from the Reclaim the American Dream web site. On a map showing US states you can find information showing legislative work being done in some states that can be inspiration and models for similar work to be done in other states.

Click here to see map
I've been adding links to sites like this to various sections of the Tutor/Mentor web library, and to the concept map shown at the right, as well as posting stories that point to some of them. (see links on right side of this blog)

I learned about the Inequality Index from an article on the From Poverty to Power blog, which is one of the blogs I point to in the web library.

I don't have any money for advertising (never had much) so use my blogs and social media to try to draw attention to the information I'm putting in my library. As others share this in their own networks, my goal is that more people will learn to use these platforms to learn what's working in some places that might also work where they are located, if they can find resources to implement the ideas.

Thus, getting people involved from every sector is really important if we want to try to reduce some of the complex problems facing us in Chicago, the US, and around the world.

You can help by following this blog, or the Tutor/Mentor blog, and sharing posts on social media sites.

If you value the work I'm doing, and the web library I host, please visit my FUND ME page and send a contribution. 


Thursday, October 19, 2017

Unique Geography Teaching & Learning Resource

I've been following a Twitter chat using the hashtag #worldgeochat and this week I saw this graphic introducing a web site titled The Human Imprint.

I took a look at the site and found it to be a treasure of information and ideas.  It was created by a geography teacher and one section is an Illustrated Textbook for teaching geography and spatial-based history, current events, environmental topics and more.

However, another section is a web library, organized in nine categories, with topics such as population and migration, urbanization, industry and economic geography, political configurations, etc.  In each section are sub-sections, which you can find using the drop-down menu. 

I've been building a web library for more than 20 years and I have two categories with links to geography and mapping resources.  The graphic at the right can be found in this presentation, describing the information library I've been building and showing my goal of finding others who are experts in specific topics. It looks like The Human Imprint is providing some of this expertise.

I encourage you to book mark the site as I did, and visit regularly.

Tuesday, August 9, 2016

Rural and Urban America Not As Different as One Might Think - Maybe

I encourage you to look at the map on this Brookings.edu article, titled "Political rhetoric exaggerates economic divisions between rural and urban America".

The map, and the article, show that "Nearly 54 percent of people living in areas classified by the Census Bureau as rural also live in a county that is part of one of the nation’s 383 metropolitan areas."

Thus, it's the other 46% who are not closely connected to any city.

This is significant because the web library I've been building since 1993 focuses on urban issues and urban poverty and inequality.  In many articles I've suggested that the largest urban areas, where school age student population is greater than 100,000 students, have  unique problems caused by the number of students and the size of the bureaucracy that are different that rural areas, where lack of density and distance between students and potential support offer barrier to place based support services like non-school tutor/mentor programs.


Thus, I've encouraged others to duplicate the Tutor/Mentor Connection, using all the same ideas and practices, but with a library that identifies uniquely rural challenges, as well as organizations that are innovating solutions to those challenges.

If you're building such a library, let's connect.


UPDATE: 8/10/2016

Recently two resources that map poverty in the Appalachian region have  come to my attention. Here's the links:

1) Community Commons web site story, Mapping Poverty in the Appalachian Region

2) Appalachian region data overview from the 2010-14 American Community Survey Chartbook

Note: Jan. 2, 2018 update
The 100 year capitalist experiment that keeps Appalachia poor, sick and stuck on coal. - article