Wednesday, August 12, 2020

Using Maps for Planning Grant Making

 I've posted several articles showing my goal of having maps used strategically in deciding where grants are distributed with a goal of coaching a better flow of operating and innovation dollars to normally neglected areas.  When I've seen a promising practice I point to it with an article and a link. Sadly, that's not too often.

However, here is something that I saw today that looks promising.  The description provided on the web site says: "The maps on this site are part of the COVID Response Dashboard, developed by the Center for High Impact Philanthropy in collaboration with Philanthropy Network Greater Philadelphia. They include grant award data from participating funds serving Southeastern Pennsylvania and Southern New Jersey."

This platform focuses on the greater Philadelphia area and on grants focused on Covid19 relief and seeks to show where funding is being distributed and where more is needed. That's a planning tool that is needed for other categories, such as youth serving organizations. 

Below is the dashboard, described as a "Strategic Planning Tool" that was created to support this project.  I'm working on an older PC so this kept crashing on me as I tried to use it, so I hope others have better luck. However, the interactivity shows excellent potential.

This platform was created by Urban Spatial, a firm located in Philadelphia and led by Ken Steif, who I met on Twitter. Browse the website to learn more about what Ken feels is the potential for using platforms like this.

My goal for 25 years has been to host a platform like this, with several layers of information. We created a version of this in 2008 when a team from India built the Chicago Tutor/Mentor Program Locator (which is now only available as an archive). 

Across the top you can see tabs opening different resources and at the left you can see tabs that represent different layers of information.  You can zoom into this and create maps focused on specific areas of Chicago, as shown by the map below.

This shows levels of poverty, locations of poorly performing schools (from 2007 or 2008), locations of non-school tutor and/or mentoring programs, and locations of assets who could help programs within a geographic area do more to help kids.  Assets would be banks, churches, colleges, hospitals, insurance companies, etc.  

I posted a blog article a few weeks ago showing layers of information needed on a platform like this. 

The platform showing Covid19 funding in Philadelphia shows additional types of information that could be layers on such a map, and a dashboard that might help people use it better.

Building a platform like this would provide a tool any one in business, philanthropy or government could use to mobilize and distribute resources into high poverty areas, supporting the growth of a range of birth-to-work programs, which I've described in these articles

The Chicago Program Locator is now out-dated and I've not been able to update it since 2013. However it still works and demonstrates what's possible.

I don't have the talent, or funds, to build and/or manage such a platform. but I've built a platform that models what's needed and a strategy that collects information and and shares it regularly so more people use the platform to support youth program growth throughout Chicago. Thus, I'd be an ideal partner/consultant to someone who has the vision, commitment and resources to build an updated version.

I'm on social media at these places. Let's connect. 

9/14/2020 update - Philadelphia looks to be using maps in creative ways. Visit this Rebuild Philadelphia page and view the data maps. 

Thursday, July 30, 2020

Youth as Leaders - Demonstrated by IntegrateNYC

View at this link
The map at the right is from a presentation about segregation in New York City and how Covid19 has had a greater affect on people of color living in highly segregated areas.

It was created as part of the IntegrateNYC project, which is lead by teens from various NYC schools. 

I encourage  you to view it, respond to their calls to action, and consider ways to empower teens in Chicago and other cities to do similar work.

Tuesday, June 30, 2020

Using maps to support growth of youth services in high needs areas

Map from 2008 
This blog was launched in 2008 to show maps the Tutor/Mentor Connection was building to draw attention and resources to non-school, volunteer-based, tutor, mentor and learning programs in the Chicago region. 

While we built this for Chicago I feel that every city in the world with a population of 1 million or more could use the Program Locator to help people living in areas of concentrated poverty.

We started creating maps showing program locations in 1994 using donated ESRI software and part time talent. We continued through mid 2000 with mostly volunteer talent and limited paid staff.

Then in late 2007 an anonymous donation of $50,000 enabled us to hire Mike Trakin as a part time map maker, using the donated ESRI software. 2008-2010 grants from HSBC helped us continue Mike's position on our staff until 2011.  Articles on this blog from 2008 to early 2011 were written by Mike, showing maps he created.  In many of these Mike pointed to my articles on the Tutor/Mentor blog, where I also showed the maps Mike was creating, along with other information.
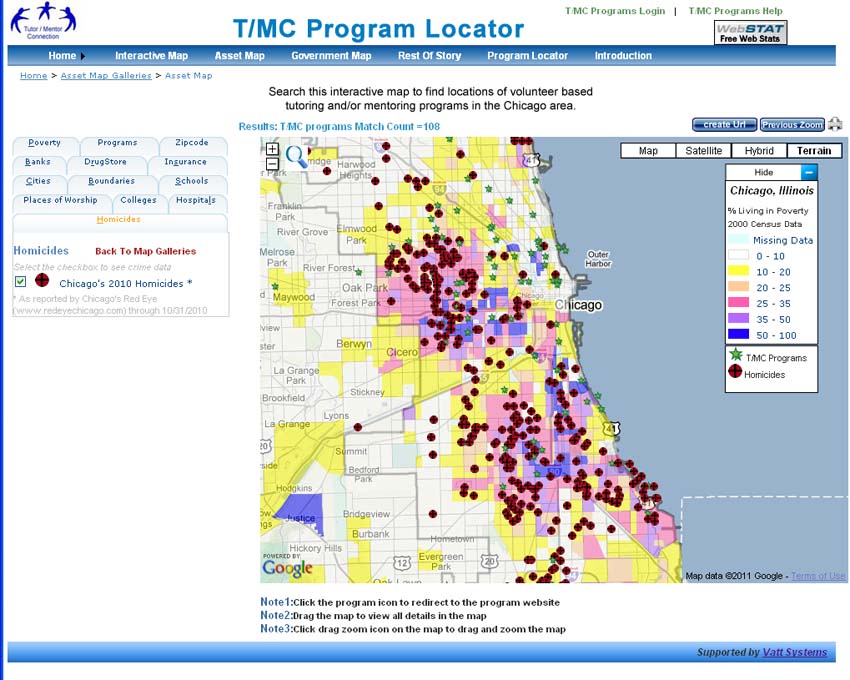
Program Locator - built 2008

2021 Note: When I posted this article in 2020 the Program Locator and OHATS were both still available. However, since early 2021 both sites no longer open and only archives of the sites are available.  I've posted links to those archives in the paragraphs below.

During the first part of 2008 Mike rebuilt our desk-top GIS mapping platform, using donated ESRI software.  Then, using half of the $50k grant, we hired a team from India, who had re-built our OHATS documentation system in 2007, to build an on-line version of what Mike had built on his office computer.

That Chicago Tutor/Mentor Program Locator was still running in 2020, but due to the financial crisis that started in 2008, was never completed, and the platform had not been updated since 2010 and the data about programs since 2013.

The platform we built in 2008 was an extension of a Program Locator platform that was built in 2004 by an intern from India (via IIT). 

This was built in 2004 - click here to open

 This platform was an upgrade to work we started in 1993 when we formed the Tutor/Mentor Connection.  We launched the first Tutor/Mentor Chicago Programs survey in January 1994 asking providers to tell us what type of program they offered (pure tutoring, pure mentoring, mixed tutor/mentor); what age group they served (elementary, middle, high school); time of day service was provided; and location with zip code.

Tutor/Mentor Directory 
From spring 1994 till spring 2002 we published a printed directory each year, which we organized into four sections of Chicago (North, Central, South Central, Far South). We mailed this to about 400 people, including all of the organizations in the directory, all libraries, Chicago Public Schools and many foundations, the Mayor, and media.  Here's a link to the 1995 Directory from my Google Drive.

The Program Locator built in 2004 was an effort to

a) make the information available to more people;

b) searchable by type of program/age group/zip code, etc; and

c) make it easier for us to update the directory, using an on-line section of the program locator, which also enabled programs to log in and update their own information. 

That database fed the Program Locator built in 2004 and the Program Locator Interactive maps built in 2008.  I used it until 2013 when I lost access due to changes in my hosting company.

I've not had a source of funding since 2011 and thus have not been able to hire people to update or rebuild the platform. While a few volunteers have helped in small ways, no one stepped forward to take full control of rebuilding.  I never could find anyone, all the way back to 1994, who could build a realistic full-cost estimate of what it would take to build the Program Locator, thus, I was always guessing when I asked donors to help. (Ask me about conversation with tech millionaire from India, held in 2008.)

With all that in mind, I'm now looking for a team to rebuild the program locator, making it open source, so that what we build can be a template that others use to build their own versions in other cities.

I created the concept map shown below to show the layers of information needed in a new version (and which was built into the 2008 version).

Open this map and click on the links under each node. 
From left to right I show

a) boundary layers - city, zip code, community area, state and federal legislative districts, etc.

b) indicators layers - poverty, violence, poorly performing schools, etc.

c) programs - while I focus on tutor/mentor programs, this could also show arts/science, or other types of services which need to be located close to consumers, meaning many are needed throughout the city.  The programs layer can be sorted by age group served, type of program, time of day
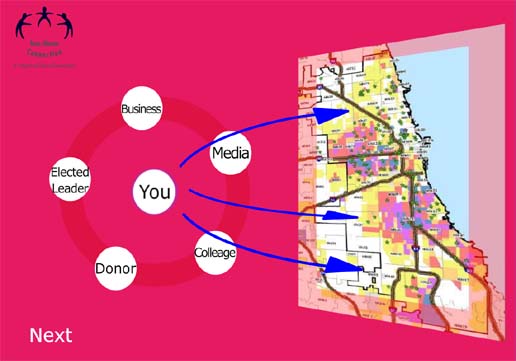
sample map
d) this shows the goal of the program locator, and the Tutor/Mentor Connection/ Institute, LLC.  We want to help leaders use this to build support for existing programs and help new ones form where needed.  At the right is an example of a map view that can be created using the program locator, then adding additional annotation using Power Point

e) assets layers - in this section you can find sub sections for banks,  hospitals, universities, faith groups, drug stores, and insurance companies, with offices/branches in different locations throughout the city. 
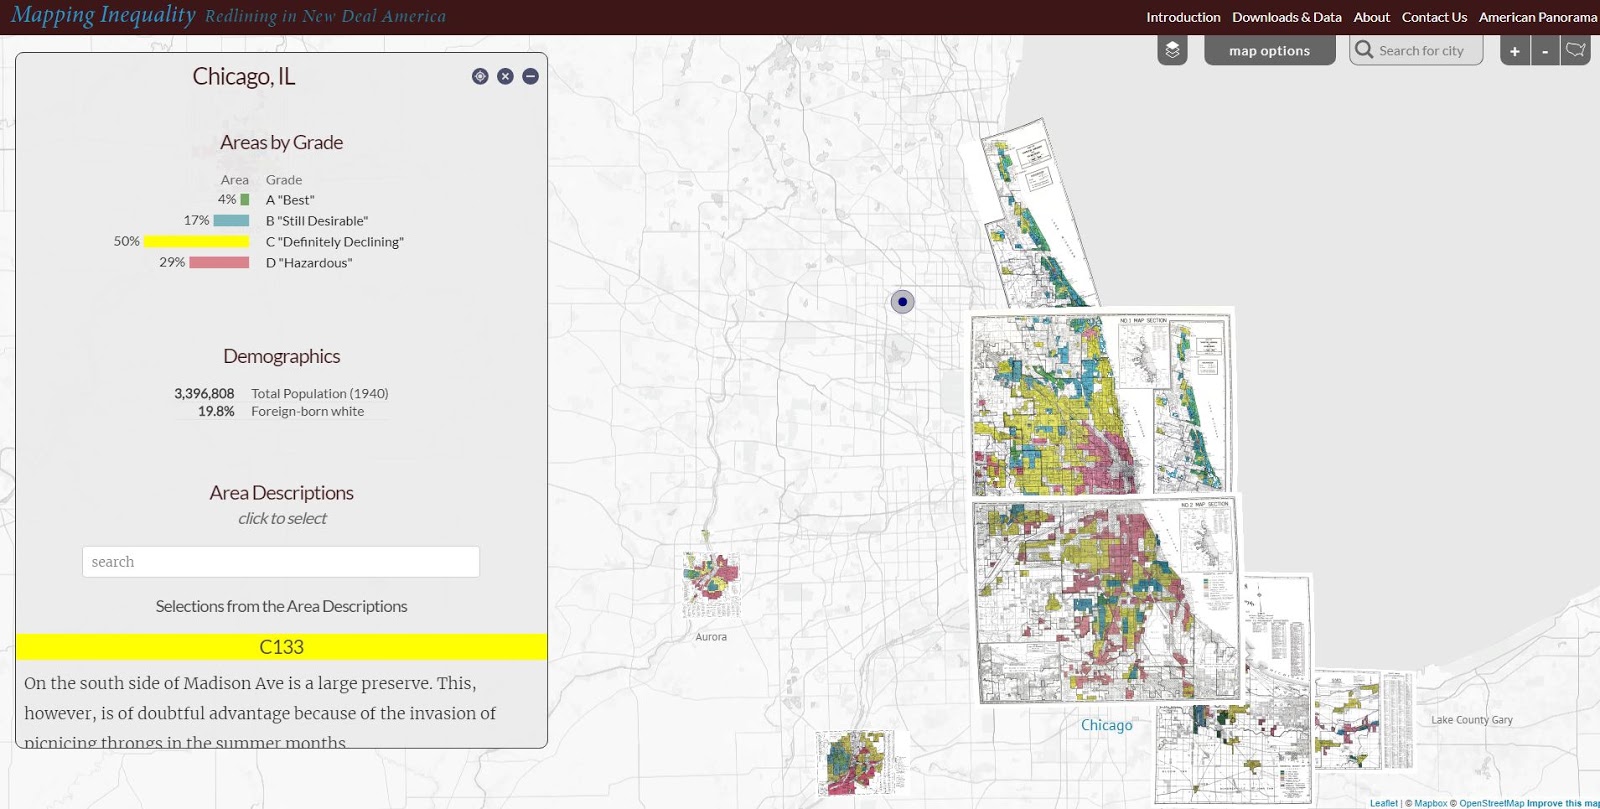
sample map
Using this information a map of a small section of the city can be created that shows indicators of need, existing programs and assets who share the geography, and thus should be expected to support programs that help kids in that area.

Ideally an updated version of the Program Locator would find ways to pull data on assets from resource files on the Internet, making this a continually updated feature.

Two features were never built into the program locator.

a) I wanted to be able to connect data from indicators into a form that program leaders (or donors) could use to determine the need for tutor/mentor programs in specific neighborhoods.  Imagine clicking on a community area and getting a form showing number of kids; level of poverty, locations of existing programs, age group, type of program, etc. A program would just fill in their program information on the form and get a printed document to send to a donor.  View this PDF to see how a map might show the number of kids in a community area. 

b) I wanted to create another layer that could be used to raise money for programs shown on the map, and to track donations to do an analysis showing the different levels of funding going to different neighborhoods.  I describe what I have in mind on this page of my planning wiki.

Since we were building this just as the financial crisis hit we never were able to complete it, nor to teach programs and resource providers to use it as intended.  In 2011 the Board of Directors of the Cabrini Connections-Tutor/Mentor Connection, voted to discontinue support for the strategy, and I was given full ownership as part of a retirement agreement.

Since 2011 I've used my own funds, plus a small flow of contributions from supporters since then to keep this platform on line as a tool, and an example.  Now it's time to find help to rebuild it and find new champions to carry this forward.

I'm seeking three levels of help.

1) get the current Program Locator fully working, which means I'd have access to the database.

2) do a full review (see wiki page links below) and create a full-cost estimate of what it would cost to rebuild this;

3) completely rebuild;  adopt the T/MC strategy in your institution, and as you do the rebuild, also do the work of updating the database and teaching people to use it.  If you're adopting this in another city, you'd need to commit to doing this part of the work. That level of help is needed in Chicago, too.

Visit this page of the tutor/mentor planning wiki to learn more of the program locator and this page to learn about our intention to uses GIS maps.

If you'd like to help, connect with me on Twitter or Linkedin.

If you'd like to help pay the bills, visit this page and use PayPal to send a contribution.

Saturday, June 20, 2020

Understanding history of redlining - Louisville, Oakland, CA, Chicago, more

See map here
The murder of George Floyd in Minneapolis in late May unleashed pent up anger in cities across the world, which continued through the Juneteenth celebrations and protest marches of June 19, 2020.

Hopefully this leads people of all backgrounds to dig deeper into the history of slavery and continued oppression of Black and Brown people that continues today.

One part of this history is 'redlining' where maps were drawn using red lines to show neighborhoods where banks and insurance companies would not invest. Those were poor neighborhoods with concentrations of Black and Brown people.

The map I'm showing here is from an article on the Bloomberg City Lab website, titled "Louisville Confronts Its Redlining Past and Present".   Visit this page to see the full presentation.

Oakland, San Francisco - redlining
These graphics are from ESRI story map presentations about 'redlining'.   While the map above focuses on Louisville, Kentucky, the maps in this story focus on Oakland and San Francisco, CA.

The ESRI story maps make great presentation platforms for this information. Scroll down the map and new images and text appear. It makes it easier to understand the stories being told.

Below is a map showing the Chicago region. It's from a Mapping Inequality project of the Digital Scholarship Lab at the University of Richmond.

Redlining in the Chicago region - see map
The Digital Scholarship Lab has maps for almost every city in America, thus, this is something that can be part of student and adult learning throughout the country.  Understanding how we got to the situation we're facing is a first step toward figuring out how to un-do the evils of past history and create a more just and equitable future.

Visit the American Panorama section on the DSL site and find story maps focusing on other issues in American history.

I found these maps on my @tutormentorteam Twitter feed then did a Google search for "Esri story maps - redlining"  and "redlining maps".  There are many other resources to learn from.

Return to this article often and read updates where I've added links to new, related, articles.


11/30/16 update: Here's a New York Times story about immigration, that uses maps and animation to tell the story in a visual way.

12/20/16 update: Here's another ESRI storymap, this time telling the story of the Dakota Access Pipeline (DAPL).

1/11/17 update: Story map showing 10 most segregated cities in the US.
 
6/28/17 update:  See how Crain's Chicago Business uses this Wealth Divides map in it's own analysis. click here

2/28/18 update:  How Cities are Divided By Income, Mapped - CITYLAB story. click here
View the ESRI Mapping Incomes story-map - click here

4/8/2018 update: Mapping Inequality: Redlining in New Deal America - this collection of Home Owners Loan Corporation (HOLA) maps from the 1920s and 1930s serve as "as critical evidence in countless urban studies in the fields of history, sociology, economics, and law. Indeed, more than a half-century of research has shown housing to be for the twentieth century what slavery was to the antebellum period, namely the broad foundation of both American prosperity and racial inequality."

4/17/2018 update:  Public Housing Plays Huge Role in Racial Segregation and Inequality-- but not in the way most people think.  Article in Business Insider - click here

4/20/2018 update: US News & World Report article - Segregation's Legacy - click here

4/24/2018 update: Segregation incarnated in brick and mortar. See maps in this April 2018 article on The Hechinger Report. 

5/3/2018 update: "Segregation Map: America is More Diverse than Ever, but still Segregated" - Washington Post article - click here

5/10/2018 update: "To Succeed Older Cities Must Overcome Their Stark Color Lines." Brookings edu article - click here

5/16/2018  update:  Metropolitan Planning Council site offers plan for addressing costs of segregation in the Chicago region. "Title: Our Equitable Future: A Roadmap for the Chicago Region". click here

5/29/2018 update:  Connecticut has more concentrated poverty (and wealth) than most metros. see 2015 article. These are findings from a DataHaven study

6/1/2018  update: The End of the American Dream? Inequality and Segregation in US Cities. Alessandra Fogli, senior economist and assistant director in the research department at the Federal Reserve Bank of Minneapolis leads a discussion about segregation and inequality across U.S. cities and their consequences on educational outcomes of future generations. see video

12/11/2018 update2018 County Health Map - Key Findings - click here  This report is a resource that can be used by leaders from across the USA.

2/20/2019 updateAmerican segregation, mapped at day and night. This site includes animated maps that show segregation patterns while at work, and while at home. Unique way to view this. click here

2/25/2020 update:  Where Democrats and Republicans live in your city.  This article includes maps that show political separation in cities across the USA, as well as racial segregation.  click here

9/21/2020 update:  Redlining and neighborhood health - click here

9/23/2020 update:  from Brookings.edu: Six maps that reveal America's expanding racial diversity. - click here

2/19/2021 update
- The Case for Reparations - Story by Ta-Nehisi Coates. Review history of slavery, Jim Crow, separate but not equal, housing discrimination, etc. in America. 

2/24/2021  update - How Black cartographers put racism on the map of America  This article shows how maps have been used in the past to fight racism and inequality.

3/5/2021 update - Race & Policing in America - storymap - click here

3/5/2021  update -
- Exploring impacts of structural racism in Chicago - click here
- Lessons from the Harvard/Brown Opportunity Atlas - click here
- Fatal Force - report on police shootings in USA - Washington Post - click here

3-6-2021 update - Mapping Project Explores Links Between Historic Redlining And Future Climate Vulnerability - click here

3-17-2021 update - NY Times article shows patterns of segregation dividing Democrats and Republicans - using maps of many cities - click here

4-2-2021 update - Redlining and Neighborhood Health - National Community Reinvestment Coalition article. click here 

9-21-2021 update - New research puts a different light on how we've traditionally understood "Redlining. Read Redlining Didn’t Happen Quite the Way We Thought It Did" - click here

11-10-21 update - "Before redlining and beyond: How data driven neighborhood classification masks spatial racism". click here

3-9-2022 update - "Redlining means 45 million Americans are breathing dirtier air, 50 years after it ended". Washington Post article. click here

4-29-2022 update - "Mapping Chicago's Racial Segregation" part 1 of 6 series in South Side Weekly - click here

5-14-2022 update - "How a Minneapolis public  history project is building political will to redress racial housing disparities" -  Brookings.edu article highlights role of the University of Minnesota Libraries in this research.  click here

5-17-2022 - School Segregation dashboard by The Century Foundation shows how segregated the schools within every metro area in the US are, including breakdowns by different types of segregation. click here

6-1-2022 - Segregation and School Funding - How Housing Discrimination Reproduces  Unequal Opportunity. New research from Albert Shanker Institute  click here

2-15-2023 - 2020 WBEZ article "Where Banks Don't Lend (in Chicago)  click  here

2-24-2023 - Follow these Tweets from David Schonholzer to see how segregation has changed (or not) in urban areas over the past 30 years. click here

This article does a great job of showing the data in the segregation dashboard. 

6-21-2023 - "School segregation thrives in America’s most liberal cities" - American Inequality article with maps. click here

12-12-2023 - Upgraded version of "Mapping Inequality," the award-winning, foremost digital resource on New Deal redlining, posted here

Thursday, April 9, 2020

Building Participation in On-Line Communities

In articles on the Tutor/Mentor blog, and on this blog, I've written about building networks of people who would work collectively to solve complex problems. I've also pointed to social network analysis (SNA) tools to map participation in events, as a resource for understanding how well different groups are doing in building engagement, and thus stimulating greater growth.

Below is a graphic showing two maps created using NodeXL SNA tools. They show two on-line events held during the first week of April 2020.

#SkollGoesVirtual (click here)  #CarnegieSummit2020 (click here)

The Skoll World Forum, organized by the Skoll Foundation, was originally scheduled as a face-to-face event, to be held from March 31 to April 3, 2020.  Due to Covid19 it was rapidly changed to an on-line format and the public was invited to join in on many of its on-line presentations, and to interact on Twitter using #SkollGoesVirtual.  I participated in one live session and then later watched two recorded sessions. I shared ideas on Twitter as I did. Here's the link to the  map shown above.   I waited too long to ask NodeXL to create this analysis, so the information shown represents the final 3 days of the on-line conference, plus conversation extending into the next week.

The Carnegie Forum was also originally scheduled to be a face-to-face event, from April 1 to April 3, 2020.  It also moved to an on-line format, using #CarnegieSummit2020.  The map shown covers Tweets from Sunday, March 29 to Saturday, April 4th, the full period of the Summit.

Unfortunately, there was a fee to participate in the Carnegie Forum, and workshops and keynotes were not streamed live on-line.  You can clearly see this impact by looking at the top map, where Tweets of 1139 Twitter users are shown; with six major clusters, representing different segments of the Skoll World Forum, while on the bottom there are 231 Twitter users, shown in one big cluster, representing information shared by the Carnegie Foundation, along with limited participation in additional clusters.


view map here
I've been trying to harness network analysis for more than 10 years. At the right is a map showing participation in tutor/mentor conferences which I hosted in Chicago in past years. See it on this 2010 blog, created by a volunteer from India who worked with me for a few months.

In 2012 interns from South Korea did an analysis of the Tutor/Mentor Connection Ning.com forum.  Here's one PDF showing that analysis. Their work is described in this blog article. 
created by interns in 2012


Unfortunately I've never been able to find volunteers who would do this work consistently, nor dollars to hire people to do it.

I learned about NodeXL in 2015 and wrote this introduction. Since then Mark Smith has been incredibly helpful in creating maps for me.

Thus, I've been sharing NodeXL maps of events for several years to encourage more leaders who organize face-to-face events to build parallel on-line activities, to engage more people in the event, increase idea sharing among participants with each other, and stimulate more on-going interactions, which are essential to any consistent and growing movement-building.


If you're in the crowd, are
your ideas being heard?
The graphic at the right expresses my feelings. If  you're sitting in a big room, you're being talked at, not with. You can barely exchange ideas with other people at your own table, let alone at other tables.  Yet you're there because you want to learn, and you want to share. You care about the topic that's being discussed. You have ideas to offer and you probably have needs for support of your own work.

On the Internet anyone has a chance for their ideas to be heard.  Organizers need to be making consistent efforts to encourage this. Network analysis maps can show how well this is happening.

It only takes a few people
to change the world.

Margaret Mead's famous quote was "Never doubt that a small group of thoughtful, committed citizens can change the world; indeed, it's the only thing that ever has,"

It Takes A Village to Raise a Child, is a related quote, based on an African proverb.

In both cases, that small group must be able to spread its ideas to larger and larger groups, with a mix of talents and networks, to truly change the world.

Network analysis tools like NodeXL can help event organizers and network builders better understand participation in events they organize, and adjust strategies so more people get involved in future events.  It's a tool to help connect networks, and bring people from silos, into collective efforts focused on common goals.  Without mapping participation how does anyone really know who is involved, or who stays involved? Especially when thousands of people need to be involved.

Today I participated in a ZOOM event hosted by Mark Smith of NodeXL, with people from around the world. You can find many and get to know their work, by visiting this Twitter list.  Or search for Twitter articles using #NodeXL hashtag, then browse articles being shared so you can learn ways to apply social network analysis in your own efforts.

Adopt this strategy
I keep looking for partners, and for people who are using network analysis tools for this purpose, and who write articles similar to mine, to help make sense of the information shown on these maps. In this article I invite universities to create an on-campus Tutor/Mentor Connection where students apply ideas I've been sharing for 20 years. One of those would be doing network analysis maps to help build participation in community-campus collaborations.

 If you're doing that please connect.  You can find me on Twitter @tutormentorteam. I'm on Facebook and LinkedIn, too.

Friday, March 27, 2020

Healing a Divided Nation

Below is a Tweet that I saw today showing vastly different levels of concern for the #COVID19 virus among Democrats and Republicans.
There are many serious divides in America. One is a political divide. One is a wealth divide. One is a racial divide. Another is a technology divide. These divisions are tearing the country apart and reducing our collective ability to solve some of these problems.  Maybe while so many are now working at home, they will spend a little time looking at these divides and look for ways to bridge them, or shrink them.

Below is an article I wrote in October 2016.. before the election. 

On Saturday, Ann Medlock, of the Giraffe Heroes Project, shared a story on Facebook that prompted me to write this.  The article is titled "How Half Of America Lost Its F**king Mind" and was talking about how so many American's are supporting Donald Trump for President.

I read the article and encourage you to read it too.  If you live in a city, some of the ideas may turn you off, or challenge your thinking. If you live in rural America, or grew up there, you might say, as the author did, "That could be me."

Included in the article was a map showing the 2012 Presidential Election voting, on a county-by county basis.

Read  more 
The red counties on this map represent rural, mostly White, America. The blue counties represent urban America, with much larger populations of people of color. Reading the article I began to look at "TWO Americas" from a "rural-urban" perspective, not just from a "White-Minority" or "Rich-Poor" perspective.

Of course, they are all related.

What's driving the motivation of rural America is a changing economy that has caused factories and jobs to leave smaller cities and rural areas, leaving poverty and a lack of hope in its wake. The article talks about how popular culture (movies, TV, radio, music), coming out of urban Ameria, have helped prepare rural America to accept Trump. One line in the article was, "He's our "asxhxxle"

I did a little more digging today, and visited the web site of Mark Newman  There are several more maps on the site, like the one below. This shows that not all of the Red counties are 100% Republican and not all of the Blue counties are 100% Democratic.


Look closer at the maps
We know how the 2016 election turned out and how the nation has become even more divided in the years since then.   

What the political maps do not show is the racial mix across America.  
The article about rural America voting for Trump does not focus on the race and inequality issues that Black American's have been focusing on, yet it's there.

I recalled another web site that I saw a couple of years ago, with what's called a "Racial Dot Map". I've included a screen shot below, showing the full country.  The map has color coded dots showing where different racial groups are most concentrated.

Racial Dot Map shows different racial mix throughout USA

You will need to open the site and zoom in to get better information from this map, but just by comparing this to the map above, you see two patterns. A large part of the Republican counties East of the Mississippi are high majority White. Cities and urban areas across the country have high minority populations.  However, the areas West of the Mississippi, mostly Republican, have very low population density. This is lack of population density is a different rural America than Appalachia and the US South.   I encourage you to read Newman's article and see how he describes how population density affects the general election vote, as well as the Electoral College vote.

My take-away?

First, the issues of race and poverty in America are complex, and getting consistent attention of people in Red and Blue states will be difficult.  For the past 40 years I have focused on helping urban areas build and sustain non-school support systems for youth living in poverty.  However, I've recognized that there needs to be a parallel group duplicating my efforts, with a focus on rural areas. I recently found an organization called Rural Assembly, who is doing some of this.

Second, the problems facing rural American and its loss of jobs, rising poverty, growing drug abuse and suicide rates is also a wicked problem, that won't be solved by more tutor/mentor programs. It's not a problem I've spent much time thinking about, since the problems I do focus on are already far beyond my own area of influence.

Below is a map showing the Digital Divide in Chicago, which I included in a December 2018 article.
Digital Divide in Chicago

This screen shot shows interactive map included in WBEZ article titled "Clear Signs Of The Digital Divide Between Chicago’s North And South Sides"

The article reports that "more than half the households in Englewood and nearly half the households in West Englewood (51 percent), Riverdale (49 percent), Auburn Gresham, and South Shore (both 46 percent), lacked internet access at home".

The closing of schools across America during COVID19 has highlighted this divide, as many students do not have the equipment and/or internet access to continue learning.  However, it's also one of the reasons many in America are not connected to the information shared on the Internet, thus are limited to radio, local faith leaders, and local networks for the ideas they believe in.

This is an important divide to understand and reduce.  Here's a link to a set of articles on this blog where I've shared more information, and links, to the Digital Divide.

Update: 3/30/2020: Here's a Tweet showing households in the USA without Internet access:

Time for deeper learning:
In articles on the Tutor/Mentor blog I focus on learning, complex problems, network building, etc. These do apply to the issues this article focuses on.  Getting more people personally engaged in learning about the problems we face, and using their own time, talent and dollars to build solutions, is the one strategy that I keep sharing that can lead to a more connected America focusing on problems, not personalities, and focusing on well-thought-out solutions, not vague promises. 

I hope you'll take a look.

Thursday, February 6, 2020

Graphic Facilitation - Another Form of Mapping

I've been using Twitter since 2009 and over the years I find it to be one of the most useful places to gather new ideas, connect and build virtual relationships.  I'm at @tutormentorteam and I encourage readers to connect with me there.

In one of my threads this week I was introduced to Aaron Johannes, @imagineacircle He leads an organization called ImagineACircle, I followed the link on his profile to try to learn what work he was doing and I see a focus on graphic facilitation. Below is just one of many visualizations he shares on the site.

See this visual in Graphic Facilitation article
I picked this one because the ideas reflect much of what I've been trying to do over the past 25 years and which I've communicated via many articles on the Tutor/Mentor blog and vis presentations that I host on the Tutor/Mentor Institute, LLC site.   I encourage you to read the article describing graphic facilitation, and browse other parts of the ImagineACircle site.

Created in 2011

I've had volunteers with different talents work with me off and on between 1993 and 2011 and had interns from various colleges work with me up till 2015.  I asked them to look at ideas I was sharing on blog articles and via ppt presentations, then create their own interpretations.  In this Tutor/Mentor forum thread you can see visualizations created by Sam Lee, an intern from South Korea, in 2011.

While I hosted Tutor/Mentor Leadership and Networking Conference in Chicago from 1994 to 2015 with attendance ranging from 200-300 in the 1990s and early 2000s, I never had anyone with graphic facilitation skills working with me to try to lead the conversation of "What are all the things we need to know and do to help kids in every high poverty neighborhood connect in organized tutor/mentor programs that help them move through school and into adult lives, jobs and careers?"


I've created a library of concept maps to visualize ideas and strategies, but these are work that I did, sitting alone at my computer, drawing from my own experiences and the library of ideas and research I've been building for over 40 years.

Thus, I'd love to see the type of graphic facilitation being done at ImagineACircle applied to the maps and graphics I've been sharing for many years, by a group of stakeholders, who might focus on Chicago, or any other city. Furthermore, I'd love to find a library where such maps are being aggregated. We could all learn from each other.


Friday, January 10, 2020

Black Owned Banks, Hotels, HBCUs - on a map

Black owned banks & credit unions
Today on Facebook one of my former Cabrini Connections students posted a map showing Black owned hotels and resorts. I visited the site and found maps showing Black owned banks and HBCUs (Historically Black Colleges and Universities). 

Here's a link to the site. Watch the videos to see how the site seeks to encourage Blacks to put their money in Black-owned businesses as a strategy to improve the lives and economic and political power of Black Americans. 

Take a look.