Showing posts with label planning. Show all posts

Wednesday, March 18, 2026

Population & Households Data - Cook County, IL

My friend Layton Olson shared a link to the Cook County Community Data Snapshots on the Chicago Metropolitan Agency for Planning website.  Open the Dashboard and you can view the data at the county, municipality and Chicago Community Area levels.  

I open the Municipality page at this link.  You can use the drop down menu to pick a community in Cook County that you want to view.  You can also select for different types of data. I chose "Population & Households".   I'm showing three examples.

Alsip


Aurora


North Chicago


For each area selected you get a view like those I've shown.  It has a map of the community showing its location in Cook County.  And it has five visualizations of the data, showing Race & Ethnicity, Language spoken at home, if not English, Household size, Age cohorts, and Household Income.

Planners who are concerned about income inequality and the negative affects of high poverty can easily see what percent of people in each area have household income below $25,000 or ranging from $25,000 to 49,000.

These would indicate how many people in the community need extra support from public and private sector support.  I'd love to find a version of these maps, with overlays showing youth serving programs in the area, sorted by type of program, age group served, etc.

Ideally someone would create a tool to collect and sort information about non-school and school-based tutor, mentor and learning programs and show where these are located, using demographic overlays to show where they are most needed.

Oh. We did that. 

View this PDF essay to see features we built into the Chicago Tutor/Mentor Program Locator when we first put it on-line in 2004, then when we updated it in 2008. 


Then view this "everyone's a map-maker" essay to see how maps could be created and integrated into public education campaigns. 

Unfortunately, I was not able to keep the Program Locator updated after 2011 and on-line after 2018.  It's now only available as and archive that anyone can use in building their own version.

In one section of the Tutor/Mentor library I point to on-line directories that I've learned about.  One project any university might adopt would be to build a program locator for their city, then have students keep it updated and leading public awareness campaigns that draw parents, volunteers, donors, media, policy-makers, and other users, with the goal of helping existing programs support long-term involvement of youth and volunteers, while helping new programs form were more are needed.

Another project would be to build a library with links to Program Locator type directories in every city in the USA and the world. That would be an extensive resource!

I'd be happy to help any university that wants to take this role.

Thanks for reading. Please connect with me on LinkedIn, Facebook, Instagram, BlueSky, Mastodon and/or Twitter - see links on this page.

 And, if you want to help me keep hosting and sharing this information, visit this page and make a contribution. 

Sunday, November 2, 2025

Cook County (IL) Digital Equity Map

I'm always looking for websites showing uses of maps to focus attention and resources on many locations where people need extra help.  Below is the Cook County Digital Equity Map.


You can find the map here.  Click here to find information about how the IMPACT Small Grants Program is providing funding and storytelling support to local nonprofits, media organizations and libraries throughout Cook County.   

Join in the on-line Chicago Hack Night presentation this coming Tuesday (Nov 4, 2025) at 7pm and learn more about this program and an IMPACT Small Grants Program.  If you can't make the live presentation all Chicago Hack Night events are recorded so you can watch them later.

City Bureau is partnering with the Cook County Board on this IMPACT Small Grants Program. 

As you look at the Cook County map, look at this visual essay that I created in 2015 to show ways to use maps to focus attention and resources on EVERY high poverty area of Chicago and its suburbs. 


In this presentation I show maps of Cook County Commissioner districts, along with other political districts, like Chicago Aldermanic Wards and Illinois State Legislative districts.


Below I show maps of Cook County Commission Districts 2 and 3, and shootings that took place in their districts. 

I did not see a feature on the Digital Equity map that sorts the information by district.  How can Commissioners be held accountable if voters can't see where people need help, and where help is going?

I'd love to see maps on websites of every elected official that mirror the thinking I share in this visual essay.  It shows a collaboration across districts, focusing on shared geography, and shared commitment to helping people who need extra help.

Maybe this is being done somewhere. If you know of such sites, please share the link.  If not, share my presentation with elected officials and encourage them to build a platform with this functionality.

Thanks for reading.  

I've been sharing this message for over 30 years, but far too few people have seen it and thus, too few are applying the ideas. You can help, just by sharing my posts.

Connect with me on LinkedIn, Instagram, Facebook, BlueSky, Twitter and other platforms. Find links on this page.

If you value what I'm sharing, please chip in to help me pay the bills. Visit this page. 

Tuesday, September 30, 2025

New example of using maps in planning

Below are two maps from an interactive tool created by Kindred Futures, that maps pathways to building collective Black wealth in the Southeast part of the USA.


These two maps are part of a set of maps that you can find at this page.  While the story features Atlanta, the interactive platform enables you to create map stories for any part of the states shown on the map.  If enough of these stories are created and shared, they can attract more interest, volunteers and investors to support the goals stated on the website.

If you browse through articles I've posted on this blog, and the Tutor/Mentor blog you'll see that I've encouraged people to create map-platforms that provide information that informs and can be used in planning.  

What's next?

My only hope is that the developers will take a further step and collect information about existing youth tutor, mentor and learning programs and plot that on maps, the way I've done for many years.  This article highlights 30 years of using maps. 


In this article you can see how I share maps created by others and show how they might be improved by adding some of the features that were put into our mapping  platforms between 2004 and 2008. 

In total, these articles are intended to stimulate thinking and innovation in how intermediaries collect data and share it on interactive platforms, with the goal of drawing resources directly to youth serving programs shown on the map, or to help leaders see where more programs need to be built.

If you're creating a platform like the ones I'm showing, post a link to your site in the comment section. Then connect with me on one of these social media channels. 

Monday, August 2, 2021

How Many Youth Programs are Needed?

Last week I posted two articles on the Tutor/Mentor blog that included the maps I'm showing below.  These show 15 Chicago community areas with high levels of shootings and homicides, considered 'high priority' by the Chicago SunTimes. 

I've combined the community area maps created by the SunTimes, with maps from the Tutor/Mentor directory to show the same  neighborhoods, locations of existing non-school, volunteer-based, tutor and/or mentor programs, and the number of high-poverty youth, age 6-17, in the area.

Here's an example: North Lawndale is on the far West side of Chicago and 4178 low income youth, which is 61% of the total youth population in that area.  

The green icons of the Tutor/Mentor map are youth programs in the Tutor/Mentor Institute, LLC's directory. (see map here). While there are seven programs, they are on the edges of the community area, except for the Better Boys Foundation (BBF Family Services).   We don't know how many youth each existing program serves, nor the age groups they serve, but if each served 100 kids weekly, it would mean 700 out of 4178 had access to a non-school tutor and/or mentor program.

Here's another example:  This shows Englewood, on the South side of Chicago, West of the Dan Ryan Expressway.  Click to enlarge the map.

The goal of creating these maps is to stimulate planning teams that help existing programs each get the operating resources needed to continue to serve youth and (hopefully) constantly improve, based on what they can learn from each other. At the same time, planning teams should identify where more programs are needed, and work to fill those voids.  


This should be happening in every community area of Chicago, as well as in Chicago suburbs and other cities.

Take a look at the two articles on the Tutor/Mentor blog. July 29 and August 1.

Since the mid 1980s I've seen stories of violence in Chicago, followed by editorials saying "demand something" or with quotes by parents saying "we need more youth programs for these kids".  Yet, there's never been an on-going, map-based planning process, intended to fill high poverty areas with a wide range of youth tutor, mentor, learning and jobs programs.


Unless that changes, it's likely the violence will continue.

If  you're using maps for this type of analysis or interested in learning more you can find me on Twitter, Facebook, LinkedIN and Instagram (see links here).   Let's connect.  

Wednesday, January 27, 2021

Chicago Community Area Maps - Invest SW Chicago

 If  you've read many of the articles on this site I show ways maps can be used for planning that fills specific geographic areas with a wide range of needed supports, including mentor-rich non-school tutor, mentor and learning programs.  I share maps created in past years by my organization and maps and data platforms created by others.

One such resource is the City of Chicago's Invest South West initiative.  The home page of the website shows a map of Chicago and the 10 featured community areas.


The Invest South West Initiative was launched in 2019.  According to information on the website, its planning conversations "have helped guide decision-making on concentration and alignment of public investments, as well as efforts to catalyze additional private investment for the 10 target neighborhoods."

For each community area a PDF map is available. The one below shows Englewood.


This map has a lot of detail but since it is in PDF format I doubt that it will do much to support planning and a deeper understanding of assets and opportunities. There's no parallel map that shows where investments have been made, or what those investments support.  Maybe that will come in the future.

I've been aggregating links that use interactive maps to support planning and I share some of these in the concept map shown below. 


Then in articles like this, on the Tutor/Mentor blog I use maps in stories intended to focus attention and resources on specific parts of the city.  The city GIS department could borrow ideas from some of these.

If you've examples of interactive maps supporting city planning, or supporting the growth of non-school youth tutor/mentor programs, in Chicago or in any other city, please share the links.  The more we can show how some people are doing this the more we can influence others to do the same, and even better.

That's the goal of the information-based problem solving strategies piloted by my organization and myself since 1993. 

Wednesday, August 12, 2020

Using Maps for Planning Grant Making

 I've posted several articles showing my goal of having maps used strategically in deciding where grants are distributed with a goal of coaching a better flow of operating and innovation dollars to normally neglected areas.  When I've seen a promising practice I point to it with an article and a link. Sadly, that's not too often.

However, here is something that I saw today that looks promising.  The description provided on the web site says: "The maps on this site are part of the COVID Response Dashboard, developed by the Center for High Impact Philanthropy in collaboration with Philanthropy Network Greater Philadelphia. They include grant award data from participating funds serving Southeastern Pennsylvania and Southern New Jersey."

This platform focuses on the greater Philadelphia area and on grants focused on Covid19 relief and seeks to show where funding is being distributed and where more is needed. That's a planning tool that is needed for other categories, such as youth serving organizations. 

Below is the dashboard, described as a "Strategic Planning Tool" that was created to support this project.  I'm working on an older PC so this kept crashing on me as I tried to use it, so I hope others have better luck. However, the interactivity shows excellent potential.

This platform was created by Urban Spatial, a firm located in Philadelphia and led by Ken Steif, who I met on Twitter. Browse the website to learn more about what Ken feels is the potential for using platforms like this.

My goal for 25 years has been to host a platform like this, with several layers of information. We created a version of this in 2008 when a team from India built the Chicago Tutor/Mentor Program Locator (which is now only available as an archive). 

Across the top you can see tabs opening different resources and at the left you can see tabs that represent different layers of information.  You can zoom into this and create maps focused on specific areas of Chicago, as shown by the map below.

This shows levels of poverty, locations of poorly performing schools (from 2007 or 2008), locations of non-school tutor and/or mentoring programs, and locations of assets who could help programs within a geographic area do more to help kids.  Assets would be banks, churches, colleges, hospitals, insurance companies, etc.  

I posted a blog article a few weeks ago showing layers of information needed on a platform like this. 

The platform showing Covid19 funding in Philadelphia shows additional types of information that could be layers on such a map, and a dashboard that might help people use it better.

Building a platform like this would provide a tool any one in business, philanthropy or government could use to mobilize and distribute resources into high poverty areas, supporting the growth of a range of birth-to-work programs, which I've described in these articles. 

The Chicago Program Locator is now out-dated and I've not been able to update it since 2013. However it still works and demonstrates what's possible.

I don't have the talent, or funds, to build and/or manage such a platform. but I've built a platform that models what's needed and a strategy that collects information and and shares it regularly so more people use the platform to support youth program growth throughout Chicago. Thus, I'd be an ideal partner/consultant to someone who has the vision, commitment and resources to build an updated version.

I'm on social media at these places. Let's connect. 

9/14/2020 update - Philadelphia looks to be using maps in creative ways. Visit this Rebuild Philadelphia page and view the data maps. 

Tuesday, April 16, 2019

Mapping Poverty and Inequality in the UK - new maps

I saw this Tweet last week and saved it to do a deeper review when I was back home from my hospital stay. 


Here's the link that the Twitter post points to.  I've been looking for someone mapping poverty and inequality in England, similar to how others have been doing this in the USA.  Here's an article I posted in 2011, following riots in London. Since then, I've  not found anyone creating maps like those I'm pointing to above.

 Of course, my goal reaches beyond just creating the poverty maps. I want people to create overlays showing where existing youth tutor/mentor and learning programs are located, and where more are needed.

Then, I want to influence the growth of teams of business, non-profit, education and community members who help existing programs grow, and share ideas, that help every program be great.

I've written about this in past articles on this blog, and on articles at TutorMentor.Blogspot.com since 2005.  I hope you'll take a look.

I show the need for planning and action teams, working at the program, neighborhood, city, state and national level. I'd like my ideas to be part of these teams and I'd like to be personally in the conversation, via Twitter, Facebook, LinkedIN, or any other format you choose.


Tuesday, February 26, 2019

The Politics of Englewood

This is a  map of the greater Englewood area of Chicago, taken from a Southsideweekly.com article titled Without Representation: How Englewood got mapped into pieces.

I drew the line down the middle to show how the Englewood and West Englewood community areas are dividied.

I've posted a number of articles featuring Englewood, on the tutor/mentor blog.

Here's one from 2009, under  headline of:

Chicago Kids Victims of Neighborhood Violence


I encourage you to read the feature article of Sunday's Chicago Tribune, titled Innocence in Peril, which shows the tragic impact of violence and drugs on kids living in the Englewood neighborhood of Chicago.

 Then I encourage you to use the interactive tutor/mentor program locator to zoom in on the Englewood neighborhood (zip code 60621) and learn about existing volunteer-based tutoring /mentoring programs, or other youth organizations that provide some form of tutoring for kids in these areas.

This is map of Englewood from Tutor/Mentor Program Locator

 When you look at this, don't think of tutoring or mentoring as a simplistic strategy that cannot overcome the complex, deeply rooted poverty, segregation and racism in Chicago. Think of this as a strategy that connects adults, businesses, faith groups and other resources beyond poverty, in long-term personal connections which transform the volunteers and what they are willing to do to help kids and families.

 If we don't increase the number of people beyond poverty, who get involved with as much commitment as they would to help their own kids, we'll never have the dollars and political will-power to change the systems of support for kids living in poverty.

 As you use the interactive map, you can create overlays showing faith groups, businesses, universities in the area who could be helping tutor/mentor programs grow. You can also look at the highways that bring working people from the suburbs, through these neighborhoods every day. Look at the faith groups on the suburban end of these highways, and think of them as partners who could be educating their members to use this information, and their resources, to help tutor/mentor programs grow in poverty neighborhoods.

Visit the Tutor/Mentor Institute to learn more about strategies that readers of this Tribune story might learn so that they are more of the solution, than a drive by reader.
-----------------------------------------

In November 2015 I wrote another article, titled "Using Maps in Long Term Planning" and showed how an area where two shootings took place had multiple layers of political representation. 

The ChicagoSouthsideweekly.com article shows how this dilutes accountability, and may be contributing to the lack of progress on some of these issues.

I've been using maps to tell stories and draw resources to high poverty neighborhoods since 1994. Browse through sections of this blog, and the Tutor/Mentor blog, to see many of these.

If you value this work, I could use some help, with contributions, to keep on doing it. Click here if interested.

Sunday, February 17, 2019

Vision for a Resilient Chicago

view map here
The map at the left shows areas of Chicago where people were living in economic hardship in 2014. The red is the areas of high impact, while the darker blue shows areas of medium impact.

This map is part of an ambitions new plan, titled Resilient Chicago, to create a Chicago "where residents, neighborhoods, institutions, corporations, and government agencies are successfully connected to each other in the pursuit of economic opportunity, safety, equity, and sustainability."

I encourage you to take time to go through all sections of the web site and download the full report.

I was not part of the planning process, which started in late 2016, and don't know if any of the ideas on the Tutor/Mentor blog, Tutor/Mentor Institute, LLC site, or this blog, were viewed by any who were part of the planning process.

However, I've been sharing maps pointing to these neighborhoods for more than 20 years, focusing on efforts that bring people together to build and sustain mentor-rich non-school programs in each of these areas, as part of a larger strategy of getting more people involved in trying to address the many problems related to poverty, segregation, income inequality, etc.

The devil is in the details. How does the city get from "here", the launch of this plan in 2019, to "there", a time in the future when most of the goals of the plan have been met?


Follow this link and view some of the articles where I've used the "here to there" concept. Maybe there will be some ideas that leaders can apply to help Chicago make this plan a success.

If you are part of this process and would like to bring me and the Tutor/Mentor Connection/Institute, LLC experience into the process, I'd be happy to connect. I'm on Twitter @tutormentorteam. I'm on LinkedIn and Facebook, too.

If you value this information, a contribution can help me keep it available. Click here

Friday, September 7, 2018

Building Networks of Support - Role of Faith Communities

The goal of the articles on this blog and the Tutor/Mentor Blog is to influence what other people do to build and sustain mentor-rich non-school programs where volunteer tutors and mentors help kids move through school and into jobs, over many years of support.

In this graphic you can see a small map of Chicago inserted at the bottom, with  high poverty areas highlighted. Comprehensive, mentor-rich programs are needed in every one of these areas.

I focus on roles business, hospitals, universities and faith groups can take to make great programs available in more places and in this article I'm introducing a new resource that shows faith groups in different zip codes of Chicago.


This map was created using the interactive map on the ARDA (Association of Religious Data Archives) web site.  This map view is showing the area around the 60640 zip code in Chicago.


Here's a second map, showing the area around the 60651 zip code, which is the Austin community area of Chicago.  There are literally hundreds of faith based groups on this map. On the graphic I'm pointing to a button you can click to get more information about the area highlighted.  At the top of the graphic I'm pointing to where you enter a zip code (any from the entire US) to find data showing faith groups in that zip code.  Spend time getting to know the site. It looks like a great resource.

Below is another map, created using the map of Chicago tutor/mentor programs that I host.  In this map I'm also showing the Austin area, along with Humboldt Park and West Garfield Park.


On this map I am showing the number of high poverty kids, age 6-17, in each of these community areas. The green icons on the map are non-school tutor and/or mentor programs in my database.

Now, if you compare my map to the map showing faith groups, you'll see that there are dozens of places where kids and volunteers could be meeting as part of organized, on-going, tutor/mentor programs.

Below are two more maps showing the Austin area. On these the blue boxes are locations of churches where mentoring programs were operating around 2011 and 12.  These never made it into my database and I can't find evidence (web sites) showing that programs are operating in these areas.


My goal is that leaders in the faith community, in hospitals, colleges and/or businesses, or even politics, use my maps and other information on my web sites, as part of a process that identifies existing programs and then draws regular, on-going attention to them, helping each attract volunteers, ideas and dollars, so youth in each program have the best possible help moving through school and into adult lives.  

Below is a presentation that shows a role faith leaders could be taking:

I've shared this since 1999 but still don't know if anyone is actually applying these ideas. However, as long as the daily news keeps reminding me of the need for support systems that help guide kids to positive life choices and adult lives where they can raise their own kids free of poverty, I'll keep sharing these ideas and resources.

If you look at the Tags on the right side of this blog you can find other articles that I've written on this topic.

If you want to help me do this, please visit this page and use the PayPal to send me a contribution.

Friday, July 20, 2018

Elections coming - Vote for People Using Maps in their Leadership

Il 4th Congressional District
The Tutor/Mentor Connection started using maps in 1994 to help leaders understand where non-school, volunteer-based tutor, mentor and learning programs were most needed, and where existing programs were located.

This blog was created in 2008 to share maps that we were able to created between then and 2011.

 I've encouraged politicians to use maps since we launched this strategy.  Sadly, I've never seen this happen consistently.

Yesterday I had another opportunity, when I had a brief discussion with a leading candidate for the Illinois 4th Congressional District election in November.  Above is a map of the district. Below is one of many presentations I've created showing uses of maps:


See more articles and ideas for using maps on this page of Tutor/Mentor Institute, LLC web site. 

Browse past articles on this blog and the Tutor/Mentor blog to see ways maps can be embedded into stories.

Help me keep the Tutor/Mentor Institute, LLC resources and stories like this on line. Make contribution using PayPal form on this page. 

Interested in helping me rebuild and update this resource? Introduce yourself with comment or connect with me on Twitter @tutormentorteam or on Linkedin.

Friday, June 22, 2018

Maps for Planning - Use Multiple Sources

Since 2008 articles on this blog have shown my uses of maps to help fill high poverty areas with youth serving organizations that include volunteer based tutor and/or mentor components. I started using maps for this purpose in 1993.

In many of the articles posted since 2011 I've shown map platforms hosted by other organizations in Chicago and in other cities.  Some contain different information, or present the information in different formats, than what I've done. 

I encourage people to learn to use these multiple platforms in their own map-stories and planning strategies. Here's an example.  The image below contains three maps showing the West side of Chicago and the Austin neighborhood.


The  infographic on the left, with a map showing the Austin neighborhood, and its location in Chicago, can be found on the Strengthening Chicago Youth web site. 

If you open the link above you will find a page listing all 77 Chicago area community areas, with an infographic like these for each area.  Shown are Austin and North Lawndale. Click on the graphic to get an enlarged version.

Open the Projects & Resources page of the SCY site and you'll see that the infographics are part of a set of actions intended to bring people together and try to develop strategies that reduce violence in Chicago.  I attend the quarterly meetings and get their monthly newsletter.

The other two maps shown above are from my collection. This map is from a pdf presentation showing the number of high poverty youth, age 6-17, in each community area on Chicago's West side. Austin and North Lawndale are at the far left.

This map was created using the Interactive Chicago Tutor/Mentor Program Locator, so it includes green stars indicating the location of non-school, volunteer-based tutor/mentor programs. On the interactive map you can zoom into an area as small as a few blocks and click on the green star to go directly to that organization's web site.*

The third map is also from the Program Locator, but I've added on a photo from an August 2017 Chicago Tribune article, reporting on a shooting that took place on the West side of Chicago. I put that map in an article on this blog. 

For this map story I used the asset map section of  the Program Locator, which enables me to show faith groups, banks, hospitals, universities and drug stores in the map area. These are people who need to be strategically involved in helping youth programs and anti-violence solutions grow. 

I share my blog articles in a monthly email newsletter which I send to people at SCYChicago and many other groups, with the goal that they will borrow some of my ideas to help draw attention to the same issues that they focus on.  I also show links to SCY and many other Chicago organizations in my newsletters and the Tutor/Mentor web library.

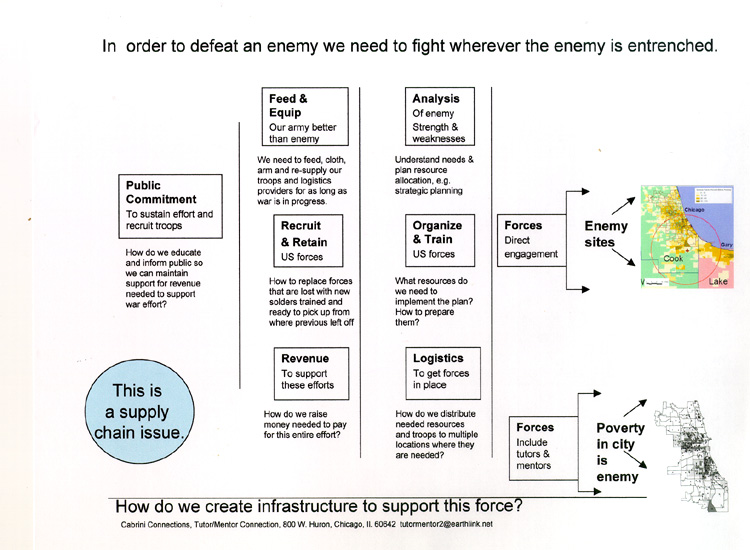
The goal is shown by this planning graphic:


If someone is collecting information showing existing service providers as well as assets in an area, then anyone can use that information to invite people to connect in face-to-face and/or on-line gatherings.

If we can encourage growing numbers of people to use maps in bringing people together and drawing attention and resources to solutions needed to reduce violence and poverty by helping more kids go safely through school and into adult lives and jobs, we can make Chicago and other cities a better place for everyone to live and raise their families.

While I've posted stories on this blog since 2008 I have also posted related stories on the Tutor/Mentor blog since 2005.  Spend time browsing through the archives. You'll find  many ideas that you can apply to change the future.

Let me know if you'd like to know more about these resources.  I'm on Twitter @tutormentorteam

* Due to a lack of funds and talent the Tutor/Mentor Program Locator has not been upgraded since 2011 and program data has not been updated since 2013.  

Thursday, March 22, 2018

Number of High Poverty Chicago Youth in Each Community Area - Change since 2011

In 2011 I produced a PDF report showing the number of Chicago youth, age 6-17, who were living in high poverty households in each community area.

This week I've received new information from the Social Impact Research Center at the Heartland Alliance, and have updated the presentation to show current numbers.

The map shown above is from the new report.  2011 numbers are shown in yellow and 2018 number in blue. This map shows the far west side where the number of high poverty youth in the Austin neighborhood has increased while in areas close to the Chicago LOOP the number has decreased.

Here's the full presentation which I've posted on Slideshare:


My goal is that people form study groups, planning groups and support groups in each community area and they use this data in an on-going effort to help build and sustain well-organized, non-school, volunteer-based tutor, mentor and learning programs in areas with a large number of kids living in poverty.

I'd be happy to spend time with such groups, helping them understand the data and the resources available to them on the Tutor/Mentor Connection and Tutor/Mentor Institute, LLC web sites.

In the report I indicated that the maps came from the Chicago Tutor/Mentor Program Locator which was created in 2008-09. I also said that I've not been able to update this since 2013 due to lack of funds and technology support.

The Program Locator still works and serves as a demonstration of the type of mapping portal needed to help people find existing tutor/mentor programs, understand the availability of such programs in different community areas, and understand who some of the assets are who should be supporting youth  in different community areas because they have facilities in those areas.

If you'd like to help, or want to meet with me,  introduce yourself on Twitter, LinkedIN or Facebook or email me at tutormentor 2 at earthlink dot net.

Thursday, February 15, 2018

Building Political Power to Enact Gun Laws in America

Another school shooting tragedy has hit America and my social media feed is full of anger at elected representatives who have done nothing over the past 20 years to make America safe again. Below is a map I found today showing school shootings since 2013.

Associated Press map - find it here
I looked through my files and I've several maps showing shootings and gun violence in America. Below is a map from 2013, showing "Gun Deaths Since Sandy Hook"


Since the second map shows outlines of all 50 states you could do a count and see that 10 to 12 states have far fewer gun deaths and school shootings than other states.  If you did the political math this would mean 20 to 24 Senators (less than 25%) might firmly oppose gun legislation because it's not a big issue in their states.  If you added up the number of Representatives in the House from those states the percent would be far below 25% since these are low population states  (and it's likely that some of the gun violence is in the big cities in these states, which means their representatives should be pro gun law voters).

So what's the problem?  Why aren't elected representatives in these other states where there is a clear problem of gun violence, doing something to change this?

A few years ago I created a pdf presentation that showed how maps could be used in a campaign to get the needed votes in the state legislature to enact effective high-school drop-out prevention strategies.  You don't  need 100% of the votes. You need 51% (or maybe 61% to over-ride a veto).

That's true at the national level too.

I've posted dozens of article on the Tutor/Mentor blog that focus on planning and leadership and many include the graphic at the right, which is from a presentation titled "War on Poverty".

A similar process needs to grow in America, where the maps above are used and are filled in with information showing that the elected local and national representatives are voting to enact radical changes in American gun laws, for the welfare and safety of the American people.

When we have the needed votes, we'll get the laws we need.

Update 2/19/18 - NPR article shows gun legislation voting records for every House and Senate rep from all 50 states.  click here

Update 2/19/18 NY Times article - Thoughts and Prayers and N.R.A. Funding - click here

Update 2/19/18 - GunControlNow - this site is collecting information on state-by-state basis. Looking for volunteers to help. See info they have for Texas.

Update 12/11/18 - Victims of Gun Violence - Philadelphia - this web site and map show shooting victims in Philadelphia

Update 5/2/2022 - Mapping Gun Violence, Brookings Metro article. click here

I'm on Twitter @tutormentorteam. I look forward to talking with you about the way I see maps being  used.

If you like what I write about and value the web library I host, please go to this link and send a small contribution. I'm paying all of my expenses from what I can raise.

Thursday, January 25, 2018

Chicago Regional Housing Solutions Dashboard

This week's presentation at ChiHackNight described a planning tool developed by the Chicago Regional Planning Agency for Planning (CMAP). Take a look at the video, then look at the screen shots I've posted below.


The dashboard Elizabeth Scott is describing can be found at https://www.regionalhousingsolutions.org/

Enter a community name, or Chicago community area name in the search bar on the middle of the page.  I entered Rogers Park, on the far North side of Chicago.

This is a screen shot of that results.  In the video Elizabeth looks at a different community. You can compare the two, or search for other communities.

Note the two rows of colored boxes to the left of the map. These are the eight issue areas CMAP data focuses on. The map is color-coded for these issues. 

Click on the name ROGERS PARK in the pop-up box on the map above, and you get a screen shot that I show at the right.  This provides an overview of what housing issues face Rogers Park.

This view also shows a list of other communities in the region, including community areas of Chicago, which profile the same way. Each of these communities could be a resource for all others.

If you scroll down on this page you come to a list of the eight issues. Click on any one of them and this type of screen opens, with a discussion of that issue and some suggestions of possible solutions.  I don't know if this section focuses on the specific community area in my search, e.g. Rogers Park, but as I find out, I'll update this post.

This is a robust and creative tool and people in every community of the Chicago region (and other places) should spend time getting to know its features. Also watch for updates showing how people are using this and how CMAP is adding new features to enhance its use.

Why is this important to Tutor/Mentor Institute, LLC? I've been trying since 1993 to create a map platform that would support policy makers in similar ways that the CMAP platform is  doing. At the right is a map view created by the Chicago Tutor/Mentor Program Locator.

So far the CMAP platform does not include poverty overlays, or other indicators such as poorly performing school, concentrations of ex-offenders, health disparities, violence, etc. 

It also does not include overlays of service providers and assets. It may in the future.

Browse this site to see  maps I've created using the Program Locator, and other maps created using ARC GIS.  Browse this section of the Tutor/Mentor blog, to see more map-views created using the Program Locator.

Here's a pdf created to show how the Tutor/Mentor Program locator can be used to make your own maps.  And, here's a wiki page where I show the goal of using maps, starting in 1993.

While I'm looking for partners who would help update the Program Locator that was built for me in 2008-09, I also point to other data indicator platforms, that people can use to create map stories that focus attention and resources on areas with high poverty. 

As you look at the features in the CMAP platform, and how they support discussions of housing issues, imagine a parallel platform supporting how communities discuss the needs of kids and the steps that would lead to better schools and a better non-school support system helping kids to careers.

I can be reached on these social media platforms or you can introduce yourself with a comment on this blog.