The map below was what caught my attention. It shows areas of concentrated poverty in six Ohio cities.
For the past 30 years I've used maps to focus attention on areas of concentrated poverty in Chicago. In this set of MappingforJustice blog articles, I show other cities with the same challenges. In the 1990s a book titled American Apartheid: Segregation and the Making of the Underclass, written by Douglas S. Massey, addressed this same issue.
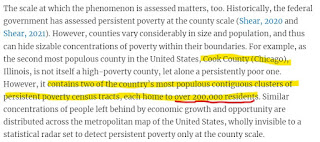
Below are a few passages from the Persistent Poverty article that I highlighted. (click to enlarge). Go to the report to read this in context.
The abstract shows a focus on social networks and social capital and says "these problems tend not to resolve themselves naturally". The second shows that hidden in affluent Cook County are several clusters of persistent poverty census tracts. Two with over 200,000 residents."
This is not a new problem. This 1994 Chicago Tribune front page pointed to some of the same high poverty areas as are shown in the Persistent Poverty report.
I formed the Tutor/Mentor Connection in Chicago in 1993 (and Tutor/Mentor Institute, LLC in 2011) to try to help volunteer-based tutor, mentor and learning programs grow in these areas as a strategy for expanding the networks of adults from beyond poverty areas who were helping kids through school. I point volunteers and donors to these programs, through lists that I host on this page.
In the Persistent Poverty report, one strategy was to expand networks of support and bridging social capital.
This paragraph highlights the difference between "bonding" social capital which consists of strong ties between family, neighborhoods and/or church groups. These are present in many high poverty communities. What's not present are large doses of "bridging" social capital, which connect youth and families to people and opportunities and solutions beyond the place where they live.
I've been writing about social capital on the Tutor/Mentor blog for many years. Add these articles to your research.
These two PDFs show this goal - Total Quality Mentoring click here
Role of Leaders - click here
Below is another graphic from my collection.
It emphasizes the role each person can take to be part of a solution. If you've read this far, that means YOU!
Read the report. Here's the link again.
Update: I asked if there is an interactive map showing the Persistent Poverty data. There is. Follow the link in this post from Twitter (x):
Using the interactive map you can zoom into the Chicago area, or any other place with high concentrations of poverty. Look at it. Create your own map stories.There is! Much of this analysis was based off of @InnovateEconomy's big Advancing Economic Development in Persistent Poverty Communities project from last summer. The tract groups view on this map brings the full geography of poverty into focus: https://t.co/1DGIT80B9h pic.twitter.com/RLnR5eL0CR
— Kenan Fikri (@kenanfikri) February 16, 2024
Then, share it with people in your network, so they read it and begin to think about roles they might take in helping more people become involved in efforts that make mentor-rich programs available in all of the high poverty areas shown on these maps.
Then visit this section of the Tutor/Mentor library and read additional reports about poverty, race and inequality in America, that I've been collecting for more than 20 years.
Help me pay the bills. Make a contribution to Fund the Tutor/Mentor Institute, LLC. click here


