Thursday, January 23, 2014

Using Maps and Media To Draw Resources to Neighborhoods

Today I posted a story on the Tutor/Mentor Blog showing how I've been creating map stories like this one since 1993, in an effort to build greater attention for tutor/mentor programs in neighborhoods where incidents of violence are highlighted in the media.

I've been doing map stories with the help of volunteers, and occasionally with paid staff, since launching the Tutor/Mentor Connection. Since I don't have advertising dollars, my strategy has been to follow news stories where violence, gangs and/or poorly performing schools have been giving front page, or major emphasis on inside pages of the Chicago Tribune or the Chicago SunTimes, which are the two major papers in Chicago, each reaching several hundred thousand readers a day.
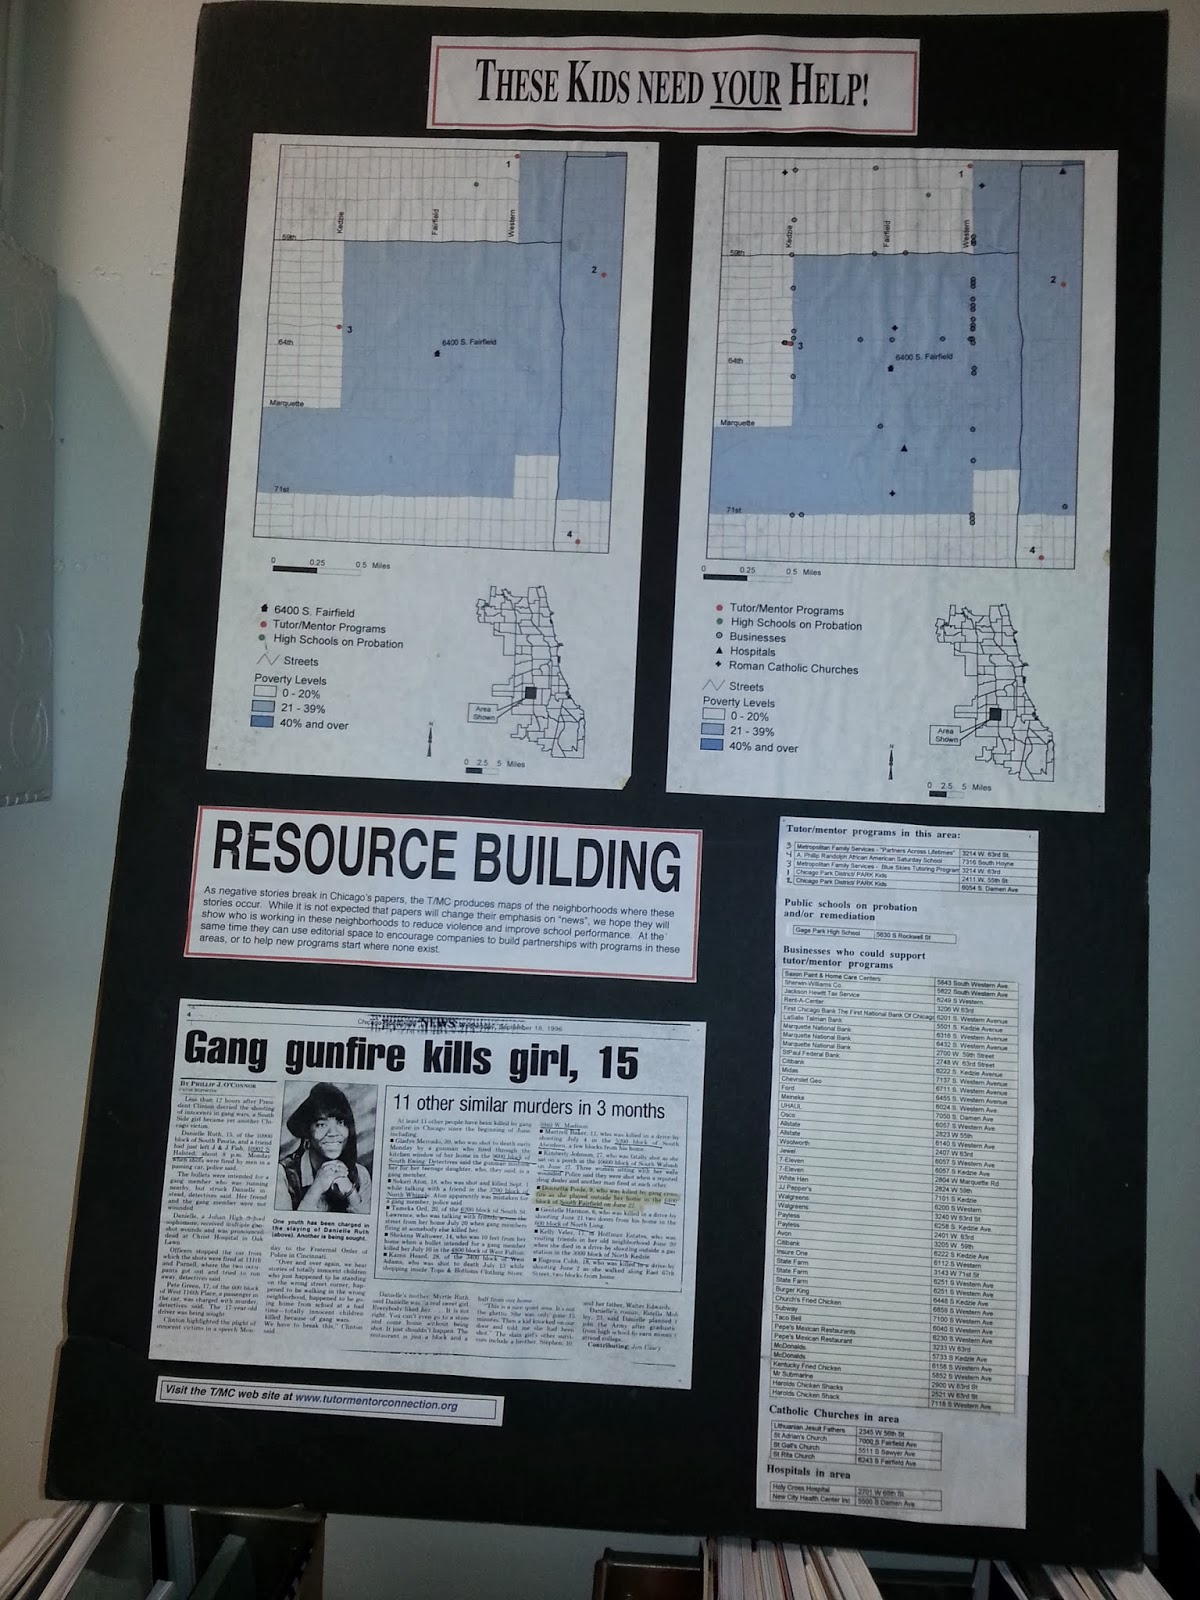
If the media story builds public interest and a desire for readers to get involved, map-stories like these can tell "The Rest of The Story", which is what the media do not do consistently include in their stories. We can show indicators of why shootings are taking place, or why students perform poorly in public schools, and we can show if there are any non-school, volunteer-based tutoring and/or mentoring programs in the area around where the story took place. We can also show some of the businesses, faith groups, hospitals and/or universities that share the same geography, and who should be strategically involved in making high quality, constantly improving tutor/mentor programs available in these areas.

Youth in middle and high schools throughout the Chicago region, and in other cities could be creating these stories, and could be involved in collecting and maintaining information about non-school programs in different neighborhoods. This article and this article offer suggestions for getting young people involved.

See additional map stories here and in the Tutor/Mentor Map Gallery.

If you're implementing this strategy, share a link to your own blog articles and connect with us on Twitter or Facebook.

Friday, December 27, 2013

Mapping the Dropout Crisis

A few years ago Compass Point created a set of maps showing high school drop out concentrations in Illinois. You can see the PDF here.

In this article from The Atlantic, you can see a map showing where the drop out crisis is most severe in the USA.

Maps help us understand that social problems are concentrated in many different places, thus, our strategies need to innovate ways to distribute resources consistently to all of the high priority places, not just a few high profile locations.

View the maps on this blog to stimulate your thinking on ways to mobilize and distribute resources to more places where help is needed so more kids go successfully from birth to work without a detour in juvenile justice or out of school.

9-25-2022 update - Maps on the Federal Reserve Bank blog show percentage of disconnected youth in every county in USA.  click here to view

Thursday, December 19, 2013

New Maps showing Racial Distribution in Chicago

Note: The links in this article no longer work.  Visit this CNN site for a 2021 version of this map.

This is a map showing racial demographics in Chicago, based on the 2013 census data. It's one of a collection of maps that can be found in this Wired.com article.

This map is called a Racial Dot Map, and "provides an accessible visualization of geographic distribution, population density, and racial diversity of the American people in every neighborhood in the entire country." This link provides an overview of the process and purpose of creating the map.

This link points to an article showing the racial dot map used to show Virginia cities.  

Use this map, along with maps showing locations of poorly performing schools, incidents of violence, health disparities, etc. and you can form an understanding of what neighborhoods and/or racial groups live in more troubled environments than others.

Use maps that show locations of non-school tutoring and/or mentoring programs and you can begin to build an understanding of which neighborhoods have programs and which don't. Further review and understanding would be needed to determine which of the existing programs are of higher quality or serve more youth than other programs, but using this information leaders should be able to form strategies that help existing programs get the resources to operate and constantly improve, while helping new programs form in areas of need.

This is the type of work Tutor/Mentor Connection has been trying to do since 1993, but with far too few dollars and talent. It's work that now is being attempted by the Tutor/Mentor Institute, LLC, but with the same lack of resources.

Tuesday, November 26, 2013

Hope for the Holidays

As we head into the holidays I wish to thank all who have helped me build these maps and the Tutor/Mentor Program Locator over the past two decades.
It's never been easy due to consistent lack of mapping talent and operating dollars. I'm in another stage where an infusion of talent is needed to update the data on the program locator and fix technology that is not working properly. As you browse through this site and see how I'm using maps, please reach out to me if you think you can help.

Tuesday, September 3, 2013

Mapping Community Health Assessment and Mobilizing Resources

This graphic is a screen shot from the Community Health Needs Assessment (CHNA)Health Indicators Map Gallery. When you open the site the maps show Atlanta. Just type in Chicago, or your own city, and new maps are created for your city.

With this type of information anyone can be creating stories showing the public where people need extra help, and could also be using resources like the Chicago Tutor/Mentor Program Locator, to overlay information showing existing service providers in each part of the community.

Throughtout this blog and the Tutor/Mentor Institute, LLC blog, stories include maps and graphics. These are intended to provide a better understanding of where and why volunteer-based tutor/mentor programs are needed, while motivating people in business, hospitals, universities, faith groups, media and politics to provide the time, talent, dollars and other resources needed by youth serving organizations in these neighborhoods.

In this page I show how interns are integrating our maps and graphics into new media, that reach people in their own networks. Similar visualizations could be created using the maps from this Community Health Needs Assessment web site.

If we teach young people to create these presentations, we teach them to think of all the actions needed to make a social service available in a neighborhood with indicators of high need for services. If they learn to use video, blogs, public presentations and music to attract attention and motivate people to become involved, they learn skills of problem solving and leadership that they can apply for the rest of their lives.

Youth don't need to create the original data and map platforms. They need to be able to tell stories using these data resources.

Thursday, August 22, 2013

Demographic map shows race distribution in US

I've been using maps to draw attention and resources to all high poverty neighborhoods in Chicago so that every neighborhood could have great youth programs operating in non school hours, not just a few great programs in a few neighborhoods. I also maintain a Tutor/Mentor Institute blog which integrates maps and map ideas in its articles. I add new articles each week, such as one today where I'm pointing to a web map of racial distribution in the US, based on the 2010 Census.

This map, and others like it, illustrate that most big cities have high concentrations of minorities, and of minorities living in high poverty. Thus, connecting people from different cities in on-line forums where we talk about the problem and innovate new ways to overcome challenges, would make sense. Talent and dollars from many places could be supporting innovations like uses of mapping, that can be applied in many other places. This is new thinking when most philanthropic support focuses close to home or where a company is located.

Maintaining a map resource requires talent, tech support and operating dollars. As we connect more people who do this work with each other, such as in this web library, my hope is that we find ways to attract these resources to all of us, and that we find ways to partner where we use scarce resources more efficiently.