Monday, February 8, 2021

Census Map Shows Home Town of Superbowl Players

 I've pointed to the US Census Bureau in past articles to show how their maps can be used to create map-stories. I was reminded of this capacity when a friend emailed me this map showing home towns of players in the 2021 Super Bowl.


You can find this map here. 

Are you using the Census Bureau platform to create map stories that draw attention to the needs of youth and families in high poverty areas of the USA?  Share links to your stories in the comments.


Wednesday, February 3, 2021

Exploring Neighborhood Change. Exploring Big Oil to Big Energy

Below I'm sharing two mapping platforms that I've discovered recently.  They both are interactive, meaning you can add or subtract layers, zoom into neighborhoods, and find useful information.

In both of these the description I'm providing comes directly from the website.

"The National Trust for Historic Preservation developed the Exploring Neighborhood Change mapping series for 10 cities as a part of an initiative of the African American Cultural Heritage Action Fund. The mapping series is designed to complement a written report entitled Preserving African American Places: Growing Preservation’s Potential as a Path for Equity, which explores the historical and present day context of African American neighborhoods to develop effective preservation-based strategies that promote justice, inclusion, and equity in our movement today."


The view I'm showing is Chicago. Visit this page to choose from nine other cities. I've added a layer showing colleges and universities. You can turn on or off different types of demographic information. 

The second map, shown below, is a resource created by Time To Change / Just Transition. The introduction from the website says "Together, map and website form a geographic information system. Its aim is to provide swift and trustworthy access to geolocated knowledge about the North American energy landscape. Publicly available data, compiled by government agencies and civil-society organizations, has been collated into three thematic sections, covering the oil & gas industry, coal and its devastating environmental consequences, and emergent electric power production based on renewables."


This platform has three maps for  a) oil and gas; b) coal and ash; c) wind and sun energy categories. The one I'm featuring shows oil and gas pipelines in North America. There's also a global version. 

As you zoom in on this map extra layers of information are provided. The blue circles are videos embedded on the map.  There's an icon for refineries. There's an icon for accidents. Click on any of these and a pop-up will provide identifying and explanatory information.


As I discover new resources such as this I've been adding them to the Tutor/Mentor web library and/or to a blog article about the climate crisis.  Below is a Tweet pointing to the new additions I made to that article. 
These show just two platforms sharing useful information via Geographic Information Systems (GIS). Scroll through articles on this blog back to 2008 and you'll find many more.

Below you can see how I've copied a map view from a mapping platform, then pasted it into Power Point, where I added a screen shot from a local news story about a shooting in Chicago, that took place in the area I've highlighted on the map.  I've been doing this since 1994 to try to draw attention and resources into high poverty areas of Chicago to support volunteer-based tutor, mentor and learning programs.


Just building the mapping platform is not enough if the purpose is that the information is used to solve a problem.  You need a strategy that turns map views into on-going stories that draw attention to the problem and draw people together to innovate solutions, then actions that over time will solve the problem, or at least reduce it.

On the Tutor/Mentor blog I've three sections with articles using maps (look at tags on left side of the blog). Read some of these and then create your own articles, from the resources above or from other GIS  platforms.  

Once you've done this share your stories on Twitter, Instagram, Facebook and/or Linkedin. I'm in all of these places (find my social media links here).  I look forward to seeing how others use these map platforms. 

Thanks for reading. 

Wednesday, January 27, 2021

Chicago Community Area Maps - Invest SW Chicago

 If  you've read many of the articles on this site I show ways maps can be used for planning that fills specific geographic areas with a wide range of needed supports, including mentor-rich non-school tutor, mentor and learning programs.  I share maps created in past years by my organization and maps and data platforms created by others.

One such resource is the City of Chicago's Invest South West initiative.  The home page of the website shows a map of Chicago and the 10 featured community areas.


The Invest South West Initiative was launched in 2019.  According to information on the website, its planning conversations "have helped guide decision-making on concentration and alignment of public investments, as well as efforts to catalyze additional private investment for the 10 target neighborhoods."

For each community area a PDF map is available. The one below shows Englewood.


This map has a lot of detail but since it is in PDF format I doubt that it will do much to support planning and a deeper understanding of assets and opportunities. There's no parallel map that shows where investments have been made, or what those investments support.  Maybe that will come in the future.

I've been aggregating links that use interactive maps to support planning and I share some of these in the concept map shown below. 


Then in articles like this, on the Tutor/Mentor blog I use maps in stories intended to focus attention and resources on specific parts of the city.  The city GIS department could borrow ideas from some of these.

If you've examples of interactive maps supporting city planning, or supporting the growth of non-school youth tutor/mentor programs, in Chicago or in any other city, please share the links.  The more we can show how some people are doing this the more we can influence others to do the same, and even better.

That's the goal of the information-based problem solving strategies piloted by my organization and myself since 1993. 

Wednesday, August 12, 2020

Using Maps for Planning Grant Making

 I've posted several articles showing my goal of having maps used strategically in deciding where grants are distributed with a goal of coaching a better flow of operating and innovation dollars to normally neglected areas.  When I've seen a promising practice I point to it with an article and a link. Sadly, that's not too often.

However, here is something that I saw today that looks promising.  The description provided on the web site says: "The maps on this site are part of the COVID Response Dashboard, developed by the Center for High Impact Philanthropy in collaboration with Philanthropy Network Greater Philadelphia. They include grant award data from participating funds serving Southeastern Pennsylvania and Southern New Jersey."

This platform focuses on the greater Philadelphia area and on grants focused on Covid19 relief and seeks to show where funding is being distributed and where more is needed. That's a planning tool that is needed for other categories, such as youth serving organizations. 

Below is the dashboard, described as a "Strategic Planning Tool" that was created to support this project.  I'm working on an older PC so this kept crashing on me as I tried to use it, so I hope others have better luck. However, the interactivity shows excellent potential.

This platform was created by Urban Spatial, a firm located in Philadelphia and led by Ken Steif, who I met on Twitter. Browse the website to learn more about what Ken feels is the potential for using platforms like this.

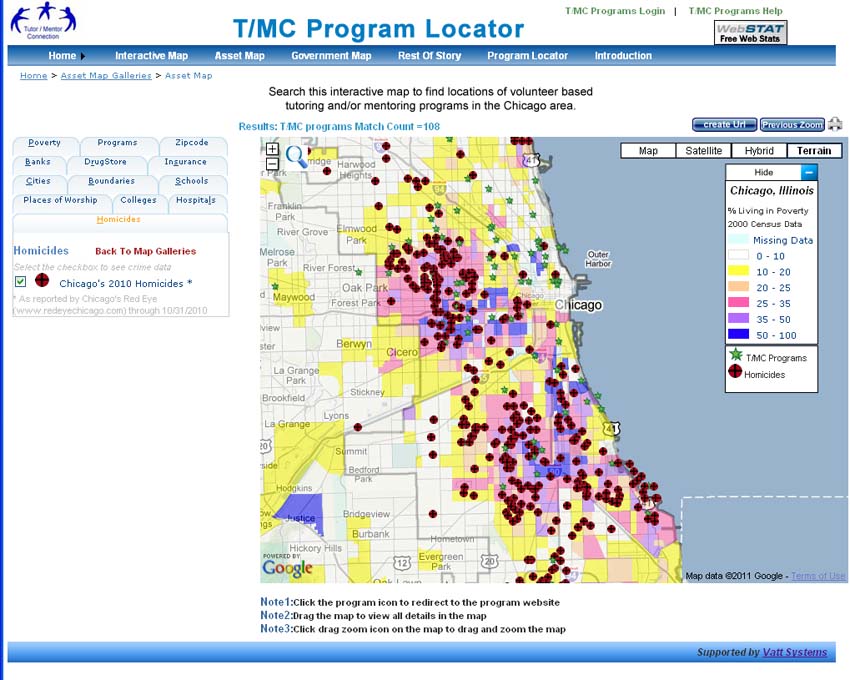
My goal for 25 years has been to host a platform like this, with several layers of information. We created a version of this in 2008 when a team from India built the Chicago Tutor/Mentor Program Locator (which is now only available as an archive). 

Across the top you can see tabs opening different resources and at the left you can see tabs that represent different layers of information.  You can zoom into this and create maps focused on specific areas of Chicago, as shown by the map below.

This shows levels of poverty, locations of poorly performing schools (from 2007 or 2008), locations of non-school tutor and/or mentoring programs, and locations of assets who could help programs within a geographic area do more to help kids.  Assets would be banks, churches, colleges, hospitals, insurance companies, etc.  

I posted a blog article a few weeks ago showing layers of information needed on a platform like this. 

The platform showing Covid19 funding in Philadelphia shows additional types of information that could be layers on such a map, and a dashboard that might help people use it better.

Building a platform like this would provide a tool any one in business, philanthropy or government could use to mobilize and distribute resources into high poverty areas, supporting the growth of a range of birth-to-work programs, which I've described in these articles. 

The Chicago Program Locator is now out-dated and I've not been able to update it since 2013. However it still works and demonstrates what's possible.

I don't have the talent, or funds, to build and/or manage such a platform. but I've built a platform that models what's needed and a strategy that collects information and and shares it regularly so more people use the platform to support youth program growth throughout Chicago. Thus, I'd be an ideal partner/consultant to someone who has the vision, commitment and resources to build an updated version.

I'm on social media at these places. Let's connect. 

9/14/2020 update - Philadelphia looks to be using maps in creative ways. Visit this Rebuild Philadelphia page and view the data maps. 

Thursday, July 30, 2020

Youth as Leaders - Demonstrated by IntegrateNYC

View at this link
The map at the right is from a presentation about segregation in New York City and how Covid19 has had a greater affect on people of color living in highly segregated areas.

It was created as part of the IntegrateNYC project, which is lead by teens from various NYC schools. 

I encourage  you to view it, respond to their calls to action, and consider ways to empower teens in Chicago and other cities to do similar work.

Tuesday, June 30, 2020

Using maps to support growth of youth services in high needs areas

Map from 2008 
This blog was launched in 2008 to show maps the Tutor/Mentor Connection was building to draw attention and resources to non-school, volunteer-based, tutor, mentor and learning programs in the Chicago region. 

While we built this for Chicago I feel that every city in the world with a population of 1 million or more could use the Program Locator to help people living in areas of concentrated poverty.

We started creating maps showing program locations in 1994 using donated ESRI software and part time talent. We continued through mid 2000 with mostly volunteer talent and limited paid staff.

Then in late 2007 an anonymous donation of $50,000 enabled us to hire Mike Trakin as a part time map maker, using the donated ESRI software. 2008-2010 grants from HSBC helped us continue Mike's position on our staff until 2011.  Articles on this blog from 2008 to early 2011 were written by Mike, showing maps he created.  In many of these Mike pointed to my articles on the Tutor/Mentor blog, where I also showed the maps Mike was creating, along with other information.
Program Locator - built 2008

2021 Note: When I posted this article in 2020 the Program Locator and OHATS were both still available. However, since early 2021 both sites no longer open and only archives of the sites are available.  I've posted links to those archives in the paragraphs below.

During the first part of 2008 Mike rebuilt our desk-top GIS mapping platform, using donated ESRI software.  Then, using half of the $50k grant, we hired a team from India, who had re-built our OHATS documentation system in 2007, to build an on-line version of what Mike had built on his office computer.

That Chicago Tutor/Mentor Program Locator was still running in 2020, but due to the financial crisis that started in 2008, was never completed, and the platform had not been updated since 2010 and the data about programs since 2013.

The platform we built in 2008 was an extension of a Program Locator platform that was built in 2004 by an intern from India (via IIT). 

This was built in 2004 - click here to open

 This platform was an upgrade to work we started in 1993 when we formed the Tutor/Mentor Connection.  We launched the first Tutor/Mentor Chicago Programs survey in January 1994 asking providers to tell us what type of program they offered (pure tutoring, pure mentoring, mixed tutor/mentor); what age group they served (elementary, middle, high school); time of day service was provided; and location with zip code.

Tutor/Mentor Directory 
From spring 1994 till spring 2002 we published a printed directory each year, which we organized into four sections of Chicago (North, Central, South Central, Far South). We mailed this to about 400 people, including all of the organizations in the directory, all libraries, Chicago Public Schools and many foundations, the Mayor, and media.  Here's a link to the 1995 Directory from my Google Drive.

The Program Locator built in 2004 was an effort to

a) make the information available to more people;

b) searchable by type of program/age group/zip code, etc; and

c) make it easier for us to update the directory, using an on-line section of the program locator, which also enabled programs to log in and update their own information. 

That database fed the Program Locator built in 2004 and the Program Locator Interactive maps built in 2008.  I used it until 2013 when I lost access due to changes in my hosting company.

I've not had a source of funding since 2011 and thus have not been able to hire people to update or rebuild the platform. While a few volunteers have helped in small ways, no one stepped forward to take full control of rebuilding.  I never could find anyone, all the way back to 1994, who could build a realistic full-cost estimate of what it would take to build the Program Locator, thus, I was always guessing when I asked donors to help. (Ask me about conversation with tech millionaire from India, held in 2008.)

With all that in mind, I'm now looking for a team to rebuild the program locator, making it open source, so that what we build can be a template that others use to build their own versions in other cities.

I created the concept map shown below to show the layers of information needed in a new version (and which was built into the 2008 version).

Open this map and click on the links under each node. 
From left to right I show

a) boundary layers - city, zip code, community area, state and federal legislative districts, etc.

b) indicators layers - poverty, violence, poorly performing schools, etc.

c) programs - while I focus on tutor/mentor programs, this could also show arts/science, or other types of services which need to be located close to consumers, meaning many are needed throughout the city.  The programs layer can be sorted by age group served, type of program, time of day

sample map
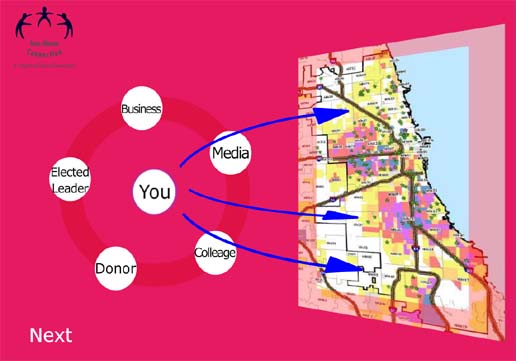
d) this shows the goal of the program locator, and the Tutor/Mentor Connection/ Institute, LLC.  We want to help leaders use this to build support for existing programs and help new ones form where needed.  At the right is an example of a map view that can be created using the program locator, then adding additional annotation using Power Point

e) assets layers - in this section you can find sub sections for banks,  hospitals, universities, faith groups, drug stores, and insurance companies, with offices/branches in different locations throughout the city. 

sample map
Using this information a map of a small section of the city can be created that shows indicators of need, existing programs and assets who share the geography, and thus should be expected to support programs that help kids in that area.

Ideally an updated version of the Program Locator would find ways to pull data on assets from resource files on the Internet, making this a continually updated feature.

Two features were never built into the program locator.

a) I wanted to be able to connect data from indicators into a form that program leaders (or donors) could use to determine the need for tutor/mentor programs in specific neighborhoods.  Imagine clicking on a community area and getting a form showing number of kids; level of poverty, locations of existing programs, age group, type of program, etc. A program would just fill in their program information on the form and get a printed document to send to a donor.  View this PDF to see how a map might show the number of kids in a community area. 

b) I wanted to create another layer that could be used to raise money for programs shown on the map, and to track donations to do an analysis showing the different levels of funding going to different neighborhoods.  I describe what I have in mind on this page of my planning wiki.

Since we were building this just as the financial crisis hit we never were able to complete it, nor to teach programs and resource providers to use it as intended.  In 2011 the Board of Directors of the Cabrini Connections-Tutor/Mentor Connection, voted to discontinue support for the strategy, and I was given full ownership as part of a retirement agreement.

Since 2011 I've used my own funds, plus a small flow of contributions from supporters since then to keep this platform on line as a tool, and an example.  Now it's time to find help to rebuild it and find new champions to carry this forward.

I'm seeking three levels of help.

1) get the current Program Locator fully working, which means I'd have access to the database.

2) do a full review (see wiki page links below) and create a full-cost estimate of what it would cost to rebuild this;

3) completely rebuild;  adopt the T/MC strategy in your institution, and as you do the rebuild, also do the work of updating the database and teaching people to use it.  If you're adopting this in another city, you'd need to commit to doing this part of the work. That level of help is needed in Chicago, too.

Visit this page of the tutor/mentor planning wiki to learn more of the program locator and this page to learn about our intention to uses GIS maps.

If you'd like to help, connect with me on Twitter or Linkedin.

If you'd like to help pay the bills, visit this page and use PayPal to send a contribution.