Showing posts sorted by relevance for query brookings. Sort by date Show all posts

Thursday, September 22, 2022

Neighborhoods of Concentrated Poverty

Below is a map showing cities in the USA with neighborhoods of concentrated poverty. It's from this Brookings Metro PDF report.  Read the introduction in this article. 


This map was part of background information showing places where communities need extra help. Solutions were offered and are described in the report, and in this webinar that introduced the report. 

The PDF report included the set of maps below, showing concentrated poverty in Chicago and other cities.  Look at maps I share below, and on this and the Tutor/Mentor blog.  I've been pointing to Chicago's West and South side neighborhoods as places needing help for more than 2 decades! 


While this is a new report and map, the problem is not new.  The map below was from a 2014 Brookings.edu report which I wrote about in this 2015 article.

Maps that show high poverty areas in Chicago and other places have driven the work of the Tutor/Mentor Connection (1993-present) and Tutor/Mentor Institute, LLC (2011-present) for more than 2 decades.  


In the 1994 Chicago SunTimes article, I'm shown with one of the students from a tutor/mentor program I was leading in Chicago. The map in the background was one produced by my organization. The shaded areas are places with concentrated poverty, where I've been trying to help volunteer-based tutor/mentor programs grow since starting the T/MC in 1993. 

So this is not a new problem. 

The student shown with me in the SunTimes article now has a graduate degree and a son in college. That's the potential impact of organized tutor/mentor programs. We need more of them. They need to reach K-12 kids in every high poverty neighborhood.  Each city shown in these maps needs a Tutor/Mentor Connection-type strategy to make this happen. 

The solution.  

The PDF that I shared above included this graphic. Communities that were able to implement all of these steps showed positive gains in reducing poverty and increasing community wealth. 


Getting more people involved in helping the neighborhood, in building and sustaining non-school learning and mentoring organizations, and drawing resources to help improve school performance, high school graduation, college attendance and graduation, are additional needed strategies.

The problems are old. The Brookings.edu/CommonGround report offers new solutions.  Implementing these requires the same strategies that have been needed for decades.

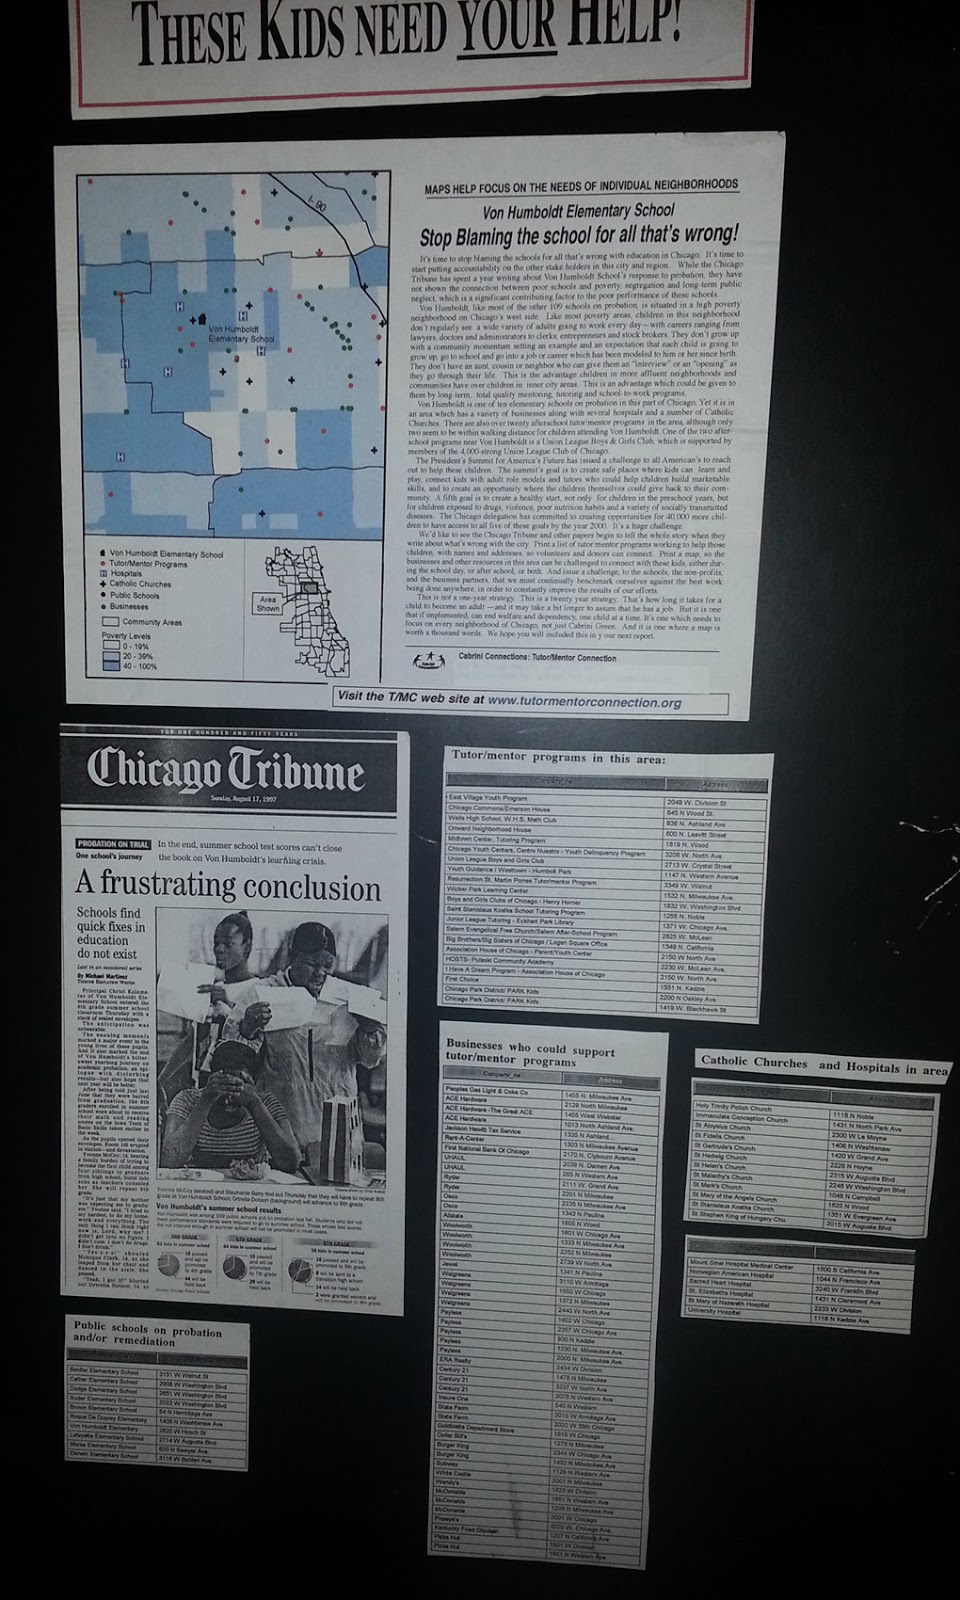
Mobilizing public attention and support that would make long-term solutions available in every one of these high poverty areas is what would be new. This 1995 Chicago Tribune article shows that I had a "master plan".


What I did not have was the ability to communicate this effectively to the millions of people who need to be involved in solutions, for the many years it takes to build involvement, build commitment to solutions, then provide funding and talent to those solutions on a consistent basis for many years.

What's needed is for many to take the YOU role shown in the graphic below.


Share my articles and the reports I point to, such as those from Brookings.edu and those listed in various sections of the Tutor/Mentor Library. 


Educate yourself. Then engage your network. Offer help. Don't wait to be asked. Build a shared understanding and "Give" until it feels good. Build habits of learning by reading these articles weekly, and pass that on to your kids.

This is a long-term problem, requiring long-term solutions. 

Thanks for reading. I'm on Twitter, Facebook, LinkedIn, Instagram, etc. You can find links on this page.

If you want to help fund the Tutor/Mentor Institute, LLC, visit this page and send a small contribution. 


Saturday, March 2, 2019

How to Increase Focus on Black Issues, when Share of US population is less than 14%

Here's a Tweet from BrookingsMetro that I saw this week:

This points to a Brookings article titled The Rise of Black-Majority Cities

Within the article is this statement: "The black share of the U.S. population rose only slightly since 1970. From 11.1 percent in 1970 to 12.6 percent in 2010." 

The map shows a heavy concentration of African Americans in the South East and along the East Coast from New York City South to Florida and in many large cities spread across the country.

I'm in Chicago, and started leading a tutor/mentor program serving African American kids living in the Cabrini Green public housing area in 1975. In 1993 I created the Tutor/Mentor Connection (T/MC) to help mentor-rich non-school programs, like the one I was leading, grow in all high poverty areas of Chicago, which were mostly African American and Hispanic neighborhoods.

I've been using maps since 1994 to show high poverty areas, in an effort to build public attention and motivate more people to provide time, talent and dollars to help youth tutor/mentor programs grow in all of these areas.

I use tags to help sort the articles in my blog, so if you click the #poverty tag, you can find a series of articles with various maps that show the demographics of Chicago the concentrations of poverty in the USA. 

Over the past 30 years the population of Black kids in the city has been decreasing.  It's still a huge number, but the Hispanic population is almost the same, and many African Americans who lived in the city are now living in the Chicago suburbs, or have moved out of state.

The work I've been doing since early 1990s is building a web library with information anyone can use to better understand issues, know more possible solutions, and then use these ideas in efforts to build and sustain youth tutor/mentor and learning programs that reach more k-12 kids in high poverty areas with support systems that help them move through school and into adult lives free of poverty.  In the concept map below I point to sections of the Tutor/Mentor Connection web library, with links to articles about poverty, race issues, inequality, Black History, etc.

In looking at the Brookings article and map I have some questions.

a) How do we attract and maintain attention and support for those kids still living in high poverty neighborhoods of Chicago as the population changes?

b) How do we attract and maintain attention on social justice, inequality and other issues that focus on the lives of people whose ancestors came to America as slaves many years ago, when most parts of the country don't have a significant population of people with this background....and when the overall percent of African Americans in the total US population is  under 14%

Do solutions need to come from cities rather than from national initiatives? Do solutions need to be regional, focusing on parts of the country with high concentrations of African Americans?

Would it be helpful to show similar maps with Hispanic and immigrant populations, showing what percent live in poverty, and where they live? Are there shared experiences that are similar, and that could create political bonds that focus on solutions at the national level?

I really don't know.

Thursday, June 8, 2023

Who is doing research about youth program availability?

 If you've read articles on this blog, going back to 2008, you'll see that the Tutor/Mentor Connection (1993-present) and Tutor/Mentor Institute, LLC (2011-present) have been trying to build a comprehensive, map-based, understanding of what non-school, volunteer-based tutor/mentor and learning programs exist in Chicago and where more are needed.  Over the past several years my capacity to do this work has been greatly reduced so I'm pleased to be able to point to others who seem to be filling this space.

Below is one slide from today's STEM Pathways Coop meeting, where Deanna Howlett of Northwestern University spoke to attendees about the Citywide State of STEM Landscape Survey.  


View the slides at this link.  Below is another slide from the presentation, showing the process intended to create understanding, and change, where change is needed.


I've shared ideas and strategies with those doing this research and participated in the meetings when they were on-line.  I look forward to more.

Today I did participate in an on-line webinar, hosted by Brookings.edu, focused on Racial Equity.  Here's one Tweet that I shared during the event. 
Visit #BrookingsRacialEquity on Twitter and see my contributions and posts by others.   As I write this post and share my ideas on Twitter and other platforms I'm trying to model a practice that I wish thousands had been duplicating for the past 10 years.  

The Internet is a huge depository of information. But unless people are aggregating it in libraries like mine, or sites like https://www.brookings.edu/blog/how-we-rise/, it will be difficult to organize learning communities that are needed to build understanding and public will necessary to impact public policy in America.   In addition to its blog and huge library of research articles you can find video archives of past webinars if you search in this section on the Brookings site. 

Share this information. Build learning circles.


You can be the YOU in this graphic by sharing my post and forwarding my Tweets, along with those of other people and organizations that I point to in my library and blog articles. 

Among many problems we face one big barrier is that there is "too much information".  We need people collecting the information, but we also need people evangelizing and trying to get growing number of people to look at the information that's been collected. Then we need even more people who are facilitating understanding and helping people connect and work together to implement solutions, in places where data maps show more people need extra help.  Colleges, public schools and faith based organizations have been doing this for centuries.  We need to duplicate that process and that requires some major benefactors who make long-term investments.

I've written several hundred articles on the Tutor/Mentor blog, that just focus on this "learning" process. Here's one.  

The Step 3 graphic above is part of this concept map, showing 4 strategies that I've followed since starting the Tutor/Mentor Connection in 1993.  I invite others to build their own version and apply this in their own work.


Thanks for reading. I hope you'll borrow from what I share here, on the Tutor/Mentor Blog and on the Tutor/Mentor Institute, LLC website.  Create your own versions. Share your own maps and blog articles. Teach others to do the same.


You can connect with me on Twitter, Facebook, LinkedIn, Instagram and Mastodon.  

If you want to help fund my work, visit this page and send a small contribution.

If you want to adopt this work and embed it in your university, I'd love to hear from you. 

Thursday, October 26, 2017

Mapping Opioid/Overdose crisis and service providers

Brookings Institute map
Yesterday I posted an article asking that someone map locations of the Digital Divide and showed a concept map outlining problems schools are facing.

 Today I found this article, with a title of "A Nation in Overdose Peril:  Pinpointing the Most Impacted Communities and the local gaps in care".

 The article shows where this crisis is most severe, where it is growing and also talks about lack of prevention and treatment non-profits in many of the areas that have the greatest need. If I had ever had a research institute to help me do the work I've been doing to identify where youth tutor/mentor programs are most needed, and where existing programs exist, my stories might have looked very much like this one.

Thus, I posted a comment on Facebook with the goal that some folks working with public health issues might be interested in what I've been doing for the past 23 years.

I decided to post that comment here, with more detail. 

Based on this article I have two comments/requests. First, have you produced a concept map/visualization showing the different treatments and prevention services that are available in some communities but not in others?

This link points to the cMap below,  showing supports kids in poverty need to move from first grade to a job. http://tinyurl.com/TMI-K-CareerMentoring


My map starts at the left, pointing to pre-school, then moves from elementary school, to middle school, high school, college/vocational school, then jobs and careers. That's a 20-30 year journey for every youth. Those living in high poverty have less support, thus non-school volunteer-based tutoring, mentoring and learning programs are a valuable resource.

Middle School
At each age level I show a range of supports that all kids need, but which are missing in many areas of high poverty.

I feel that a similar map could show a time line of first exposure to potential drug abuse and the causes of addiction, to a later stage where a person is heavily addicted and needed specialized treatments. At the right end of the time like could be the post addition recovery stages, showing supports still needed.

At each stage having the appropriate supports and treatment could make a huge difference.

The information the Brookings Institute is collecting to produce this article could be organized into a web library sorted by the categories on the concept map, making these resources available to every community in the country/world.

The second question asked if the Brookings Institute has plotted its data about service providers on a map, as an overlay to the maps showing distribution of the problem? I have been plotting locations of non-school tutor/mentor programs on maps since 1994. The map at the right is created using a Chicago Tutor/Mentor Program Locator pilot which was built in 2008.

The maps force leaders to think of all the places where help is needed. Without mapping resource providers you could fill a stadium with people doing this work and still not be reaching most places where help is needed.

With this information people concerned with the problem could begin a marketing campaign intended to help existing providers continue to provide services while helping others build new service distribution points, borrowing from what is working in other places. If someone is doing this please share the links.

Using the information you collect in a campaign intended to draw resources to the areas where extra help is needed is the 4-part strategy the Tutor/Mentor Connection developed in 1994 and has been using since then (since 2011 as part of Tutor/Mentor Institute, LLC).  Just showing where the program is located, and talking about some causes is only part of what needs to be happening.

If some is interested in talking more about what I've just suggested,I'll post this on my blog and look forward to connecting.

Update: 10-27-17- Here's a link to a Jan 2016 New York Times story with maps showing drug overdose deaths each year since 1999.

Update: 10-12-18 - Here's useful article in USNews about the challenges of solving the opioid epidemic.

Update: 10-25-18- America's 150 Year Opioid Epidemic - NY Times article  click here

Saturday, June 20, 2020

Understanding history of redlining - Louisville, Oakland, CA, Chicago, more

See map here
The murder of George Floyd in Minneapolis in late May unleashed pent up anger in cities across the world, which continued through the Juneteenth celebrations and protest marches of June 19, 2020.

Hopefully this leads people of all backgrounds to dig deeper into the history of slavery and continued oppression of Black and Brown people that continues today.

One part of this history is 'redlining' where maps were drawn using red lines to show neighborhoods where banks and insurance companies would not invest. Those were poor neighborhoods with concentrations of Black and Brown people.

The map I'm showing here is from an article on the Bloomberg City Lab website, titled "Louisville Confronts Its Redlining Past and Present".   Visit this page to see the full presentation.

Oakland, San Francisco - redlining
These graphics are from ESRI story map presentations about 'redlining'.   While the map above focuses on Louisville, Kentucky, the maps in this story focus on Oakland and San Francisco, CA.

The ESRI story maps make great presentation platforms for this information. Scroll down the map and new images and text appear. It makes it easier to understand the stories being told.

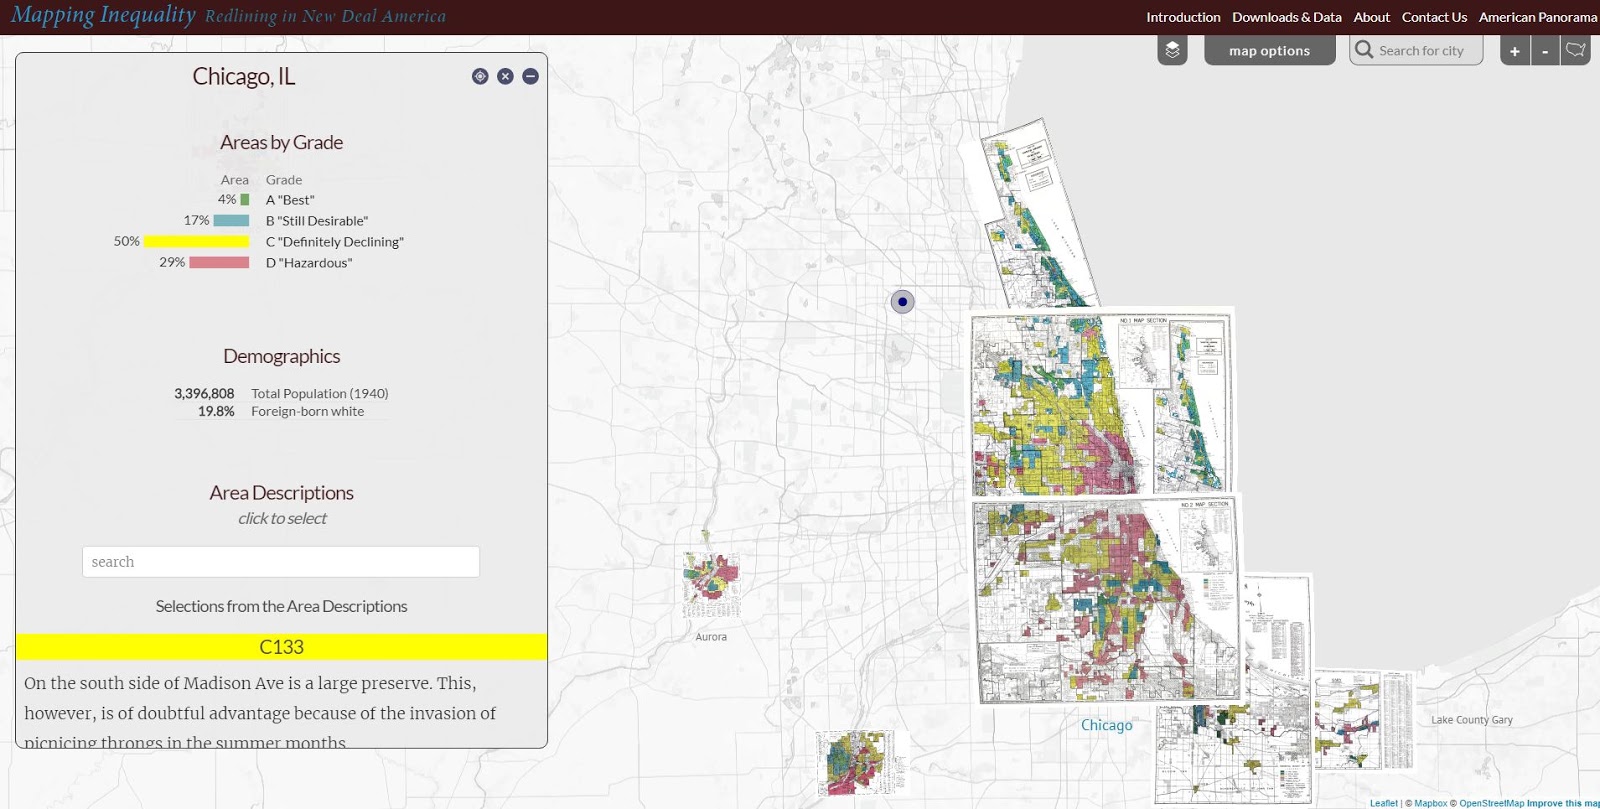
Below is a map showing the Chicago region. It's from a Mapping Inequality project of the Digital Scholarship Lab at the University of Richmond.

Redlining in the Chicago region - see map
The Digital Scholarship Lab has maps for almost every city in America, thus, this is something that can be part of student and adult learning throughout the country.  Understanding how we got to the situation we're facing is a first step toward figuring out how to un-do the evils of past history and create a more just and equitable future.

Visit the American Panorama section on the DSL site and find story maps focusing on other issues in American history.

I found these maps on my @tutormentorteam Twitter feed then did a Google search for "Esri story maps - redlining"  and "redlining maps".  There are many other resources to learn from.

Return to this article often and read updates where I've added links to new, related, articles.


11/30/16 update: Here's a New York Times story about immigration, that uses maps and animation to tell the story in a visual way.

12/20/16 update: Here's another ESRI storymap, this time telling the story of the Dakota Access Pipeline (DAPL).

1/11/17 update: Story map showing 10 most segregated cities in the US.
 
6/28/17 update:  See how Crain's Chicago Business uses this Wealth Divides map in it's own analysis. click here

2/28/18 update:  How Cities are Divided By Income, Mapped - CITYLAB story. click here
View the ESRI Mapping Incomes story-map - click here

4/8/2018 update: Mapping Inequality: Redlining in New Deal America - this collection of Home Owners Loan Corporation (HOLA) maps from the 1920s and 1930s serve as "as critical evidence in countless urban studies in the fields of history, sociology, economics, and law. Indeed, more than a half-century of research has shown housing to be for the twentieth century what slavery was to the antebellum period, namely the broad foundation of both American prosperity and racial inequality."

4/17/2018 update:  Public Housing Plays Huge Role in Racial Segregation and Inequality-- but not in the way most people think.  Article in Business Insider - click here

4/20/2018 update: US News & World Report article - Segregation's Legacy - click here

4/24/2018 update: Segregation incarnated in brick and mortar. See maps in this April 2018 article on The Hechinger Report. 

5/3/2018 update: "Segregation Map: America is More Diverse than Ever, but still Segregated" - Washington Post article - click here

5/10/2018 update: "To Succeed Older Cities Must Overcome Their Stark Color Lines." Brookings edu article - click here

5/16/2018  update:  Metropolitan Planning Council site offers plan for addressing costs of segregation in the Chicago region. "Title: Our Equitable Future: A Roadmap for the Chicago Region". click here

5/29/2018 update:  Connecticut has more concentrated poverty (and wealth) than most metros. see 2015 article. These are findings from a DataHaven study

6/1/2018  update: The End of the American Dream? Inequality and Segregation in US Cities. Alessandra Fogli, senior economist and assistant director in the research department at the Federal Reserve Bank of Minneapolis leads a discussion about segregation and inequality across U.S. cities and their consequences on educational outcomes of future generations. see video

12/11/2018 update:  2018 County Health Map - Key Findings - click here  This report is a resource that can be used by leaders from across the USA.

2/20/2019 update: American segregation, mapped at day and night. This site includes animated maps that show segregation patterns while at work, and while at home. Unique way to view this. click here

2/25/2020 update:  Where Democrats and Republicans live in your city.  This article includes maps that show political separation in cities across the USA, as well as racial segregation.  click here

9/21/2020 update:  Redlining and neighborhood health - click here

9/23/2020 update:  from Brookings.edu: Six maps that reveal America's expanding racial diversity. - click here

2/19/2021 update
- The Case for Reparations - Story by Ta-Nehisi Coates. Review history of slavery, Jim Crow, separate but not equal, housing discrimination, etc. in America. 

2/24/2021  update - How Black cartographers put racism on the map of America  This article shows how maps have been used in the past to fight racism and inequality.

3/5/2021 update - Race & Policing in America - storymap - click here

3/5/2021  update -
- Exploring impacts of structural racism in Chicago - click here
- Lessons from the Harvard/Brown Opportunity Atlas - click here
- Fatal Force - report on police shootings in USA - Washington Post - click here

3-6-2021 update - Mapping Project Explores Links Between Historic Redlining And Future Climate Vulnerability - click here

3-17-2021 update - NY Times article shows patterns of segregation dividing Democrats and Republicans - using maps of many cities - click here

4-2-2021 update - Redlining and Neighborhood Health - National Community Reinvestment Coalition article. click here 

9-21-2021 update - New research puts a different light on how we've traditionally understood "Redlining. Read Redlining Didn’t Happen Quite the Way We Thought It Did" - click here

11-10-21 update - "Before redlining and beyond: How data driven neighborhood classification masks spatial racism". click here

3-9-2022 update - "Redlining means 45 million Americans are breathing dirtier air, 50 years after it ended". Washington Post article. click here

4-29-2022 update - "Mapping Chicago's Racial Segregation" part 1 of 6 series in South Side Weekly - click here

5-14-2022 update - "How a Minneapolis public  history project is building political will to redress racial housing disparities" -  Brookings.edu article highlights role of the University of Minnesota Libraries in this research.  click here

5-17-2022 - School Segregation dashboard by The Century Foundation shows how segregated the schools within every metro area in the US are, including breakdowns by different types of segregation. click here

6-1-2022 - Segregation and School Funding - How Housing Discrimination Reproduces  Unequal Opportunity. New research from Albert Shanker Institute  click here

2-15-2023 - 2020 WBEZ article "Where Banks Don't Lend (in Chicago)  click  here

2-24-2023 - Follow these Tweets from David Schonholzer to see how segregation has changed (or not) in urban areas over the past 30 years. click here

This article does a great job of showing the data in the segregation dashboard. 

6-21-2023 - "School segregation thrives in America’s most liberal cities" - American Inequality article with maps. click here

12-12-2023 - Upgraded version of "Mapping Inequality," the award-winning, foremost digital resource on New Deal redlining, posted here

5-31-2024 - NCRC (National Community Reinvestment Corporation ) article titled "Decades of Disinvestment: Historic Redlining and Mortgage Lending Since 1981" - https://ncrc.org/decades-of-disinvestment/  This report introduces a new HMDA Longitudinal Dataset (HLD).  

11-3-2026 update - A new index examines the widening gaps in opportunity, wealth, and social connection within America’s cities—and why those divides can hold entire metros back. Read Seth Kaplan's article at https://flourishingneighborhoods.substack.com/p/the-neighborhood-divide-holding-cities

Thursday, December 14, 2017

Racial Segregation in Metro Areas - Brookings report

Map from Brookings.edu report
This is one of four sets of maps included in this article describing continuing racial segregation in 24 large metro areas of the United States.  Take a look.

Read other articles that focus on race and segregation that I've posted on this blog.

Saturday, August 20, 2016

Race Riots Hit Milwaukee - Missed Opportunity

Pent up anger has now been unleashed in Milwaukee, following a police shooting. This follows Ferguson, MO, and Baltimore. What city will be next?

I started the Tutor/Mentor Connection (T/MC) in Chicago in 1993 with a goal of helping volunteer-based tutoring and/or mentoring programs grow in high poverty neighborhoods.  I used a quarterly newsletter to share this vision and to share information from my web library. In the mid 1990s I was invited by the Milwaukee Foundation to add about a dozen organizations from Milwaukee to the distribution list, which I did.  In the following years I met with leaders from Milwaukee, and people representing Milwaukee programs came to Chicago for the spring and fall Tutor/Mentor Leadership and Networking Conferences.

However, this never led to adoption of the Tutor/Mentor Connection strategy in Milwaukee.  It's never been adopted in Chicago, either.

Below is a map that shows the racial concentrations in Milwaukee. I've pointed to this mapping platform below, showing racial distribution in Chicago.

If someone in Milwaukee were leading a T/MC strategy they would be able to produce a map like this, with overlays showing locations of non-school tutoring, mentoring and learning programs.  Using that map the would be leading a year-round marketing campaign intended to draw volunteers and donors to existing programs, while helping groups create new programs where more are needed. They would have people meeting regularly to share ideas and they would have people connecting with programs in Chicago and other cities to borrow ideas from more places.
The first map below was created using the Chicago Tutor/Mentor Program Locator, which the T/MC built in 2008, but which has not been funded since 2010. It's a model that should be duplicated. It is also a starting point for people who want to partner in stead of starting from scratch.


This second map is from a Brookings.edu article, showing cities around the country with the same problems as Milwaukee, Chicago, Baltimore, etc. I wrote about it here.

Leaders in everyone of these cities should be reading this article that I shared on the I-Open Blog, which focuses on the Cleveland, OH area.

If you cannot answer "YES, We do." you should be creating a team to begin digging into the ideas I have been sharing for the past 20 years, and you should be inviting me to meet with you to help you understand and apply those ideas.

It's not a quick fix.  But you don't want to look back in a few years an say "I wish we had done that."

8-21-16 UPDATE:  Here's a New  York Times article titled "Affluent and Black, and Still Trapped by Segregation".   In addition, here is a concept map showing the research section of the Tutor/Mentor web library, which included many articles related to place, race and poverty.   Until many more people are reading these articles, and combining their learning with direct interaction across race and poverty boundaries, too few will have enough information or commitment to actually find solutions.

12-27-16 UPDATE:  Here's another article that uses maps to focus on violence in Milwaukee.  Here's article I wrote showing need for groups of people --a village-- to form in different neighborhoods to try to solve these problems.

8-4-17 UPDATE:  Here's article titled "Structural Causes of Racism and Economic Segregation in SE Wisconsin.

11-10-17 Update: Here's an article showing "The 5 Worst Cities for Black Americans".  Milwaukee and Racine, Wisconsin are on the list.

2-7-2018 Update:  Brookings report: City and metro income inequality data through 2016- article


Wednesday, December 23, 2015

Chicago Most Segregated City in US - Brooking.edu

I included this map from a Brookings.edu article in a story I posted here in May 2015. 

Today I received another article from Brookings,edu, under the headline "The Most American City: Chicago, race and inequality". 

I have started using an annotation tool to highlight and comment on articles like this. Here's the link to the annotated version.  

The writer finises with a comment saying, "The broader tragedy of Baltimore, of Ferguson, of Chicago, is that black and Hispanic Americans in the poorest areas of our cities have such bleak prospects. The danger is that once the media bandwagon has moved on, these structural inequalities will remain."  

The strategies I've launched since 1993, through the Tutor/Mentor Connection, have aimed to keep attention focused on issues like this, even when the media are not paying attention.  Read stories on this blog and the Tutor/Mentor Institute, LLC blog, to see how I've been doing that for the past 10 years. 

Tuesday, May 21, 2013

Responding to Growth of Suburban Poverty

I encourage you to read this article on Mother Jones, showing the dramatic growth of poverty in suburbs of Chicago and other cities.

Note: when I first published this article in 2013 I also included a link to a Brookings.edu article. That link is broken. However,  here are some other articles about suburban poverty.

The Growth and Spread of Concentrated Poverty: 2000 to 2008-2012. Brookings.edu. click here

Poverty is Moving to the Suburbs. The War on Poverty Hasn't Followed. Washington Post 2018 article

11-2018 update:  WBEZ report: An American Suburb, 2018.  Story shows how poverty is becoming greater in suburbs of cities like Chicago than in those cities.  Read the four part series. click here

4-19-2019 update: This US News report article is titled The Suburban Myth of Health and Wealth and focuses on the hidden pockets of poverty in wealthy suburbs like In New York’s Nassau County.

10-24-2019 update:  Suburban Poverty article on Tutor/Mentor Blog - click here

2-7-2026 update - WBEZ article "Dozens of Chicago suburbs have shifted to majority nonwhite" - click here

The strategies I've shown for building a distribution of mentor-rich programs in inner city neighborhoods will need to be expanded to reach youth in high poverty neighborhoods. Will you help?

Friday, March 9, 2012

Interactive map shows access to jobs

I attended a Community Development Conference in Chicago and this opened up a wide range of new resources that I was not aware of and that might be useful to those working for the well-being of young people and families.

One speaker was from the Brookings Institution Metropolitan Policy Program. When I visited his web page I found this information about "Transit Access, an interactive mapping application associated with the Missed Opportunity transit report, which presents metropolitan and neighborhood-level information on how transit connects workers to jobs in the nation’s 100 largest metro areas. See the map at http://www.brookings.edu/metro/jobs_and_transit/map.aspx

Saturday, July 4, 2015

Duplicating this discussion in different cities

I included this map of Minneapolis in a 2014 article on the Tutor/Mentor Blog.

Today I read a Brookings.edu article, titled The Changing Face of the Heartland: Preparing America’s Diverse Workforce for Tomorrow. It's a long article, but full of maps and charts and ideas that a relevant in Chicago and every other urban area of the country. This article not only focuses on the economic need to find ways to parepar minorities for greater roles in the workforce, but talks about the type of long term philanthropic support needed to achieve desired outcomes.

One quote from the article says "We’re not talking about a pilot program or a two-year effort. … We’re talking about a 5–10 year commitment, and [dollar] numbers much bigger than what you might have had in mind. … "

We need this type of discussion, with the same use of maps, in every city. If you can point to a site where a similar article focuses on Chicago, please share it.

If you don't have the Brookings.edu daily bulletin sent to you, I encourage you to subscribe. Some of the best writing on opportunity and equality that I've found.

Monday, November 28, 2016

Income Inequality in Cities - Using ESRI StoryMap

This image is from an ESRI Storymap titled "Wealth Divides" that you can find at this link.

This demonstrates a growing ability to use story maps to build a greater understanding of how some places are blessed with great wealth while others are less fortunate due to great poverty.

I'll reach out to ESRI, but the next layer of information on maps like this should be borrowed from my own  history of building map overlays that show locations of non-school tutor and/or mentoring programs in different neighborhoods, as part of a strategy intended to draw resources to existing programs while helping new programs start where few or none exist.

Here's a blog article that illustrates how I've been trying to use maps. Imagine what might result if teams of students, volunteers and map-makers were duplicating the Tutor/Mentor Connection's 4-part strategy, and were producing map stories using current StoryMap tools, to draw attention to inequality, violence and other indicators of need, and were drawing resources to organizations working to reduce those inequalities.

That could be happening in every part of the world if a few leaders would step forward to make it happen.

11/30/16 update: Here's a New York Times story about immigration, that uses maps and animation to tell the story in a visual way.

12/20/16 update: Here's another ESRI storymap, this time telling the story of the Dakota Access Pipeline (DAPL).

1/11/17 update: Story map showing 10 most segregated cities in the US

6/28/17 update:  See how Crain's Chicago Business uses this Wealth Divides map in it's own analysis. click here

2/28/18 update:  How Cities are Divided By Income, Mapped - CITYLAB story. click here
View the ESRI Mapping Incomes story-map - click here

4/8/2018 update: Mapping Inequality: Redlining in New Deal America - this collection of Home Owners Loan Corporation (HOLA) maps from the 1920s and 1930s serve as "as critical evidence in countless urban studies in the fields of history, sociology, economics, and law. Indeed, more than a half-century of research has shown housing to be for the twentieth century what slavery was to the antebellum period, namely the broad foundation of both American prosperity and racial inequality."

4/17/2018 update:  Public Housing Plays Huge Role in Racial Segregation and Inequality-- but not in the way most people think.  Article in Business Insider - click here

4/20/2018 update: US News & World Report article - Segregation's Legacy - click here

4/24/2018 update: Segregation incarnated in brick and mortar. See maps in this April 2018 article on The Hechinger Report. 

5/3/2018 update: "Segregation Map: America is More Diverse than Ever, but still Segregated" - Washington Post article - click here

5/10/2018 update: "To Succeed Older Cities Must Overcome Their Stark Color Lines." Brookings edu article - click here

5/16/2018  update:  Metropolitan Planning Council site offers plan for addressing costs of segregation in the Chicago region. "Title: Our Equitable Future: A Roadmap for the Chicago Region". click here

5/29/2018 update:  Connecticut has more concentrated poverty (and wealth) than most metros. see 2015 article. These are findings from a DataHaven study

6/1/2018  update: The End of the American Dream? Inequality and Segregation in US Cities. Alessandra Fogli, senior economist and assistant director in the research department at the Federal Reserve Bank of Minneapolis leads a discussion about segregation and inequality across U.S. cities and their consequences on educational outcomes of future generations. see video

12/11/2018 update:  2018 County Health Map - Key Findings - click here  This report is a resource that can be used by leaders from across the USA.

2/20/2019 update: American segregation, mapped at day and night. This site includes animated maps that show segregation patterns while at work, and while at home. Unique way to view this. click here

2/25/2020 update:  Where Democrats and Republicans live in your city.  This article includes maps that show political separation in cities across the USA, as well as racial segregation.  click here

9/21/2020 update:  Redlining and neighborhood health - click here

9/23/2020 update:  from Brookings.edu: Six maps that reveal America's expanding racial diversity. - click here

11/23/2021  update: The Ever-Growing Gap: Failing to Address the Status Quo Will Drive the Racial Wealth Divide for Centuries to Come - Institute for  Policy Studies report - click here   

Thursday, September 19, 2019

Factors that affect learning - interactive map

In a Twitter chat today I learned about a new map by Brookings.edu and the @hamiltonproject. I show it below. Visit this article to read about the map and learn how to use it.

Open map - click here
You can zoom into the map and enlarge it to focus on different places around the USA.  I zoomed into the Chicago region and created the map view shown below:

Open map - click here

Each dot on this map is an individual school.  So I zoomed in even more to focus on one school, which I chose at random.

Open map - click here
The blue circle focuses on Daley Elementary School, where student chronic attendance is 18.2%, which you can see if you put your icon on the red dot. 

The red circle focuses on the wider area around this school, where most students live.  I've been trying to coach schools, businesses, faith groups, hospitals and others to fill the red circle with a wide range of volunteer-based tutor, mentor and learning organizations so kids come to school more prepared to learn and leave with networks that help them into jobs.

I've been trying for 20 years with limited success. I keep trying. 

Below is another map, created in 2017 from the Chicago Tutor/Mentor Program Locator, which my organization created in 2008 (it's not been updated since 2013).

View Program Locator - click here
On this map I show layers of information, that includes existing non-school tutor/mentor programs in the area, as well as assets who could be helping programs and schools help kids, such as faith groups, businesses, hospitals and universities.  The map shows who is in the same geography, thus who has a reason to help.

Most of the map platforms that show data, don't do what the Program Locator was intended to do. And, I've not had the resources or partnership to keep updating the Program Locator, or to keep adding to its features.

Chicago programs
In 2016 I created a new map platform, which is kept updated. See it here.  Unfortunately  this does not have the layers of information, or search features of the program locator. You can zoom in and put your mouse over a green icon to learn who that program is.

It's not enough to just point to where kids need help. We need to  help build a support system of people and organizations who devote time, talent, dollars and votes over many years to help kids grow up.

If you'd like to know more, connect with me on Twitter, Facebook or Linkedin.  If you'd like to make a contribution (not tax deductable) to help me, click here.

Wednesday, May 13, 2015

Big City Poverty - Baltimore not Alone.

This image is from this Brookings report article, titled "Good fortune, dire poverty, and inequality in Baltimore: An American story".

It shows that the conditions of inequality and concentrated poverty that contributed to the Baltimore riots this spring are present in many major US cities. To me, this means each city should have a Tutor/Mentor Connection strategy, which is outlined in the concept maps shared in articles on this blog, and on pages of the Tutor/Mentor Institute, LLC web site.


This map shows a long-term commitment every leader in a city needs to adopt, and demonstrate in their actions. If you follow the lines on the concept map, the line in the center points to this four-part strategy, which supports the involvement of leaders with information they can use to reach youth and families in all high poverty areas of any city.

Friday, September 13, 2019

Understanding Racial Diversity in USA

Below is one of six maps shown in a Brookings.edu article titled "Six Maps that Reveal America's Expanding Racial Diversity".

Run your pointer over the maps and you'll get data for every county showing the percent of each racial group in that county.

In theory you would expect a greater percent of minority elected officials, at the local, state and federal level, in those areas showing high concentrations of African American and Latino populations. 

Take some time to read the full article. 

Monday, April 20, 2015

15 US Cities Where Poverty Growing Fastest

This map is from a Brookings.edu 2014 research brief, titled "The Growth and Spread of Concentrated Poverty, 2000 to 2008-2012".

Every circle on the map represents a community that could adopt the Tutor/Mentor Connection strategy, supported by the Tutor/Mentor Institute, LLC.

Friday, June 10, 2016

Mapping Participation In Events - June 8 example

Last fall I shared a tutorial for using NodeXL to show participation in Twitter conversations. Then, I created a this map and article showing participation in the Mentoring Summit last February. In May 2016 I created another map and article, showing  participation in The #onthetable2016 event hosted by The Chicago Community Trust.

Today I'm sharing three maps, which show participation in two important conversations held on June 8, 2016. One was a #promisechat hosted by the America's Promise organization, created following the 1997 President's Summit for America's Future. The second was an #Educationdisparities chat, hosting by the Brookings Institution. These were back to back, one starting at 1pm CST and the other at 2pm CST. The maps below show participation in each event, then show participation in both events. This shows the crossover of people who participated in both, such as myself.


Open these links to see the actual maps #promisechat - click here 

 #educationdisparities - click here 

Combined #promisechat and #educationdisparities - click here 

There's much that event organizers can do using these maps, to understand who they are reaching, and to plan future events that recruit more who need to be involved in these conversations. 

There's also much that anyone using Twitter can do to learn who the major influencers in each conversation are, and to reach out and begin to build a relationship by following them. 

I want to thank Marc Smith and NodeXL for creating these maps for me at no cost. 

Connected Action creates maps for business users for a $79.95 per map fee, and they offer discounts to registered non-profits. Interested organizations are encouraged to request a few sample network maps and reports to understand their value and application.

Click the http://www.connectedaction.net/shop link to learn more about their work and how you can begin to obtain maps like these.

Use the coupon code sna4nptmi and receive a non profit discount. The first 50 to use this code will receive their first two maps for free.

Other links to view to learn more.


For those who may be interested in learning more about network analysis and tools they might use, here's one article you might look at. If you want to dig deeper, this link points to a site where I've aggregated a few more article to read..